Search
`
August 28, 2024

NYISO 20-Year Forecast Highlights Generation, Tx Hurdles to Climate Goals

NYISO’s first 20-year economic planning forecast paints a daunting picture of the challenge facing New York in meeting its climate goals: More than 95 GW of new zero-emission resources must be added to the grid by 2040, 20 GW within the next seven years.

“That is significant,” NYISO’s Jason Frasier said in presenting the inaugural System & Resource Outlook to the Business Issues Committee on Wednesday. The 2030 goal represents half of the ISO’s current 40-GW fleet.

Complicating matters, as fossil generation is eliminated, the state will need new clean energy generation technologies — potentially hydrogen, renewable natural gas and small modular nuclear reactors — which the report calls “dispatchable emission-free resources.”

Also daunting: building the transmission needed to deliver that power. “The current New York transmission system, at both local and bulk levels, is inadequate to achieve currently required policy objectives,” the ISO says in the report. “Some renewable generation pockets throughout the state already face curtailments. More curtailments will be experienced in the future [absent transmission upgrades] as an increasing number of intermittent generation resources interconnect.”

The Need for Change

The outlook, which will be performed every two years, replaces Phase 1 of the Congestion Assessment and Resource Integration Study (CARIS).

The new planning process was prompted by the 2020 Accelerated Renewable Energy Growth and Community Benefit Act, which mandated a statewide transmission planning study to achieve the targets of the 2019 Climate Leadership and Community Protection Act (CLCPA): 70% renewable energy by 2030 (70×30) and 100% zero-emissions by 2040.

The “plan further supports the state’s mission by quantifying the evolving challenges in the electricity sector resulting from widespread beneficial electrification,” the ISO said.

NYISO won FERC’s approval for the new process last year, telling the commission in its transmittal letter that “no single NYISO planning study summarizes and evaluates the totality of New York state’s transmission system needs” (ER21-1074).

Cumulative contracted renewable capacity (NYISO) Content.jpgCumulative contracted renewable capacity additions by online year | NYISO


The ISO said the shift from CARIS’ 10-year horizon to a 20-year study period would “better capture trends in system congestion[,] the full benefits of potential transmission upgrades” and the long-term impacts of the CLCPA mandates. It also aligns with the 20-year study period that the ISO uses to evaluate proposed transmission solutions to address congestion in the Economic Transmission Project Evaluation (previously CARIS Phase 2).

The outlook assesses congestion statewide, in contrast with CARIS, which focused on only the top three congested transmission paths based on production costs — ignoring congested paths with lower production cost impacts but potentially higher benefit-to-cost ratios.

Under the previous process, NYISO also limited its transmission planning to the bulk power transmission facilities (BPTF) portion of the state’s transmission system (generally 230 kV and higher), leaving its transmission owners to plan their local systems. Under the outlook, the ISO will identify congestion throughout the transmission system, although its evaluation of proposed transmission solutions will remain limited to the BPTFs, supplemented by transmission owners’ local plans.

“Much of the transmission congestion identified in the 70×30 scenario resulted from local transmission constraints, which would likely not be identified in the top three most congested paths on the New York state transmission system,” the ISO said.

The ISO said the new process will improve its analysis of the benefits of interregional transmission. “Based on past CARIS studies, interregional congestion has not risen to the top three most congested paths in order for it to be analyzed,” it said.

Under the new process, the ISO will conduct its assessments of “generic” solutions (transmission, generation, demand response and energy efficiency) to the Requested Economic Planning Study (formerly the “Additional CARIS Study”) and the Economic Transmission Project Evaluation.

Unchanged is the ISO’s process for evaluating proposed economic transmission projects or identifying load-serving entities that benefit from projects. The 80% voting threshold required for LSEs to approve such projects also is unchanged.

Four Futures

 The outlook considered four potential futures:

  • The Baseline Case assumed little change from the status quo.
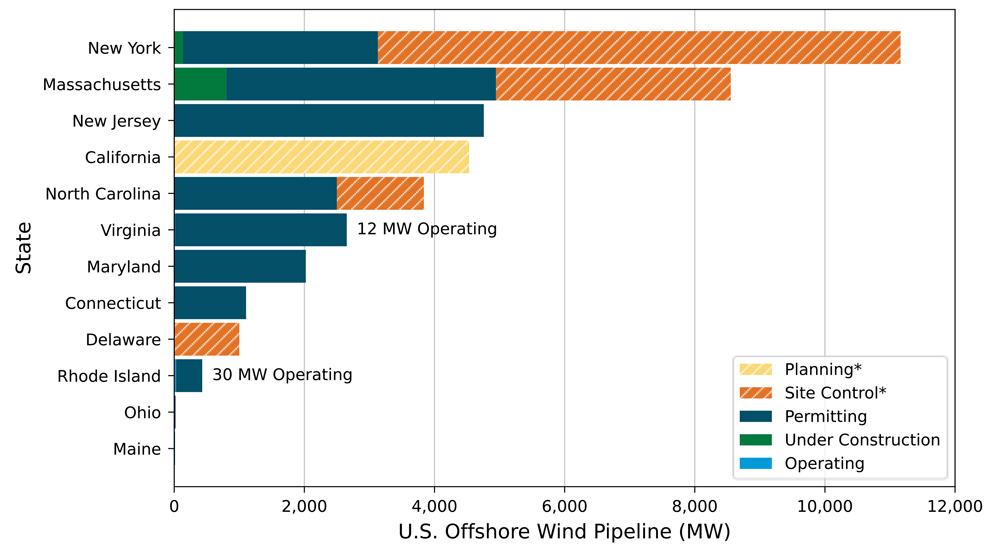
  • The Contract Case includes nearly 9,500 MW of renewable capacity procured by the state (4,262 MW of solar, 899 MW of land-based wind and 4,316 MW of offshore wind).
  • The Policy Case looks at two futures selected from dozens of preliminary scenarios that varied based on factors such as capital costs and demand forecasts. “Among all factors tested, the demand forecast demonstrated the largest impact on the resulting capacity expansion,” the ISO said.
    1. Scenario 1 envisions high demand (57,144 MW winter peak and 208,679 GWh energy demand in 2040) with fewer restrictions on renewable generation buildout options and land-based wind largely used to meet emission targets.
    2. Scenario 2 used assumptions consistent with the New York Climate Action Council’s Integration Analysis and sees a moderate peak but a higher overall energy demand (42,301 MW winter peak and 235,731 GWh energy demand in 2040) with a mix of land-based wind and solar.

DEFRs

The 20 GW of new generation needed in the next seven years dwarfs the 12.9 GW of generation developed since wholesale electricity markets began more than 20 years ago, the report notes. Over the past five years, 2.6 GW of renewable and fossil-fueled generation came into service — while 4.8 GW was deactivated.

NYISO Policy Case Scenarios (NYISO) Content.jpgNYISO’s two “Policy Case” scenarios use land-based wind (LBW), offshore wind (OSW), utility-scale solar (UPV), behind-the-meter solar (BTM-PV) and energy storage (ESR) to meet the state’s climate policy mandates through 2035. | NYISO

The 9,500 MW of new contracted renewable resources projected would be a five-fold increase in the ISO’s current utility-scale renewable fleet. “Without any major transmission upgrades planned to specifically address this large influx of contracted renewables, transmission congestion increases. When the contracted renewable projects are added, several additional constraints appear, causing a 23% increase in congestion statewide by 2030.”

Most of the renewable projects are expected to be upstate solar or downstate offshore wind projects scheduled for installation before 2026. (In 2021, zero-emission resources made up 91% of upstate production, while fossil units dominated downstate (89%).)

The future will also mean an increase in dispatchable generator starts and stops and daily ramping to address the variability of wind and solar generation. While flexible units will be dispatched more frequently, they will operate for fewer hours within the year.

To achieve the CLCPA target, all fossil generation is assumed to be retired by 2040, replaced by “dispatchable emission-free resources” (DEFRs), “a proxy technology that will meet the flexibility and emissions-free energy needs of the future system but are not yet mature technologies that are commercially available.”

Scenario 1 assumes 45 GW of DEFR capacity by 2040 because of a 35% higher peak load forecast than Scenario 2, despite a 13% lower annual energy demand. The report notes that New York’s current fossil fleet is only 26 GW. Scenario 2 envisions 27 GW of DEFRs by 2040.

A scenario in which DEFRs are not available because of a lack of investments in research, development and commercialization “exhausts the amount of land-based wind built and results in the replacement of 45 GW of DEFR capacity in Scenario 1 with 30 GW of offshore wind and 40 GW of energy storage,” the outlook says.

That would also necessitate system reinforcements to address voltage support and dynamic stability problems that would arise without the fossil fleet or DEFRs.

Transmission Curtailments

New York is expected to see a major reduction in congestion on its Central East interface once the AC Transmission Public Policy projects in the Mohawk and Hudson Valleys are completed in 2024 and more than 10 GW of nuclear plant capacity in Ontario is retired or shut down for refurbishments by 2025. Nearly all of the economic energy exports to NYISO from the Ontario Independent Electric System Operator are delivered via the Central East interface.

But the reduced congestion will be short-lived as new renewables are connected upstream of the Central East interface, the outlook says.

A lack of sufficient transmission would result in increasing curtailments of both renewable and dispatchable generation, with renewable generators averaging 5 GWh per year in the Baseline Case, rising to 163 GWh in the Contract Case. Most of the curtailments affect offshore wind projects connected to Long Island, the report says.

The report predicts curtailment of at least 5 TWh of renewable energy in 2030 and 10 TWh in 2035 because of transmission limitations in renewable pockets. “This equates to roughly 5% less renewable energy that can be produced, and thus may not be counted toward the CLCPA targets.”

Generation Pockets

The report identifies four “generation pockets” that will need transmission expansions to avoid “persistent and significant limitations” to deliverability:

  • Long Island offshore wind: NYISO is currently evaluating proposals submitted in response to the Long Island Offshore Wind Export Public Policy Transmission Need, which could reduce projected congestion “significantly,” according to the report. The solicitation seeks to deliver at least 3,000 MW of offshore wind by increasing the export capability of the LIPA-Con Edison interface connecting Zone K to Zones I and J and upgrading associated local transmission. “However, offshore wind resource additions of up to 20 GW that are under discussion may necessitate additional transmission to deliver offshore wind energy to New Yorkers,” the outlook says.
  • The Watertown/Tug Hill Plateau renewable generation pocket (designated as X3 on the ISO’s map): The 115-kV network can’t deliver all of the already-contracted wind and solar generation in the area, and congestion will worsen with integration of more renewables.
  • Southern Tier (Z1) and Finger Lakes (Z2) renewable generation pockets: The areas are attractive to wind and solar developers. “Transmission expansion from this pocket to the bulk grid would benefit New York consumers statewide,” the report says.

Comments

The outlook was generally well received by BIC members, who voted to recommend it to the Management Committee. That committee is scheduled to vote on it on Aug. 31, which will be followed by a vote by the ISO’s Board of Directors in late September. The ISO will then hold a public information session on the report.

Chris Hall, of the New York State Energy Research and Development Authority (NYSERDA), praised the report, although he said the authority “didn’t necessarily agree with every single modeling assumption” and will propose changes in the future. NYSERDA would have liked more time for the study, he said, “but we recognize pencils have to be put down at some point.”

Mark Younger of Hudson Energy Economics noted that while the outlook considered major changes in New York, it did not address the scale of changes occurring in neighboring regions. He argued that NYISO should not draw any conclusions about how it should address its interface with its neighbors without more analysis on the degree to which they can provide each other excess energy when it is needed.

Attorney Doreen Saia, of Greenberg Traurig, said she was concerned that the outlook’s executive summary focuses on changes needed as the state approaches 2040.

“There’s a very significant need now and in the near term. And I don’t want that to get muted,” she said. “We have to presume that there will be some subset of folks who only read the executive summary.”

Zach Smith, NYISO vice president of system and resource planning, said the ISO’s communications about the report will note the timing considerations at issue.

Next Steps

NYISO said data from the outlook will be used in the 2022 Reliability Needs Assessment (RNA) to identify commitment and dispatch trends and reliability impacts, as well as in the 2022 Grid in Transition study.

The ISO will open a 60-day comment period at the end of August or early September for its 2022-2023 Public Policy Transmission Planning cycle.

“The challenges identified in the outlook cannot be solved by any single entity,” the report says. “The full set of comprehensive electric system requirements will need participation among policymakers, generator owners, transmission owners and consumers. Communication and collaboration between stakeholders is essential to making progress toward achieving policy objectives while maintaining an efficient power market and reliable power grid.”

West Coast States Ask FERC to Deny Gas Pipeline Expansion

Attorneys general for California, Oregon and Washington asked FERC Monday to deny an application to expand the capacity of a pipeline system that delivers natural gas to the three states.

Their argument: all three states have taken legal measures to trim their methane emissions while the pipeline expansion would increase those same emissions.

Gas Transmission Northwest (GTN) is seeking permission from FERC to expand the capabilities of three compressor stations — Athol Compressor Station in Kootenai County, Idaho; the Starbuck Compressor Station in Walla Walla County, Wash.; and the Kent Compressor Station in Sherman County, Ore. The improvements would add a transmission capacity of 150 million cubic feet per day (CFD) to the pipelines that move gas from Canada to Washington, Oregon and California.

That translates to 3.47 million extra tons of carbon dioxide annually for the next 30 years in those three states, according to the joint filing to FERC by the three states. The project’s budget is $335 million with the costs being passed on to GTN’s current ratepayers. The joint filing contends Houston-based GTN has not guaranteed that new customers will pay for the proposed expansion.

GTN currently delivers up to 2.7 billion CFD in natural gas to customers in in the Northwest and California. The company owns 1,377 miles of pipelines in those three states and Idaho.

“This project undermines Washington state’s efforts to fight climate change,” Washington Attorney General Bob Ferguson said in a news release. “This pipeline is bad for the environment and bad for consumers.”

Ferguson argued that GTN is pitching its proposal to FERC as improvements in reliability to the existing pipeline system when it really wants to expand.

“The West Coast is experiencing very real impacts of climate change and leading the climate fight, so it is fitting that Oregon, Washington and California band together on this joint motion asking FERC to take a hard look at this pipeline proposal,” Oregon Attorney General Ellen Rosenblum said in the same release.

California Attorney General Rob Bonta added: “Expanding the capacity of this pipeline would have significant environmental and public health impacts and is out of step with state and federal climate goals, and FERC can’t honestly say otherwise. The reality is, when we expand gas infrastructure, it’s all too often minority, low-income and Indigenous communities that pay the price.”

GTN provided NetZero Insider with a statement that did not specifically address the complaints laid out by the three attorneys general in their filing.

“Natural gas is a critical component of any strategy to meet our North American energy needs today and in the future and has contributed to reduced greenhouse gas emissions on the continent,” the company said. “The Gas Transmission Northwest XPress Project (GTNXP) is designed to upgrade our system to meet increased demands from our customers in the region, providing the reliable energy to communities throughout the Western U.S. in a safe, responsible, and reliable manner.”

Washington’s legislature passed a law to incrementally trim statewide GHG emissions to 95% of the 1990 level by 2050. By 2045, retail electricity must be 100% emissions-free. In mid-2023, the use of natural gas for HVAC systems in new buildings will be outlawed.

Oregon has required its major investor-owned utilities, Portland General Electric and PacifiCorp, to become 100% renewable by 2040. Those utilities represent 87.8% of greenhouse gasses that electricity suppliers emitted as of 2020, the joint filing said.

California’s targets include reducing the state’s overall GHG emissions to 40% below 1990 levels by 2030 and 80% below that level by 2050.

California and Washington have the nation’s only two cap-and-trade programs to reduce carbon emissions.

MISO, SPP Regulators Finish Pancaking Strawman

A working group of MISO and SPP state regulators addressing rate pancaking issues agreed Monday that their work is finished and ready to be turned in to the Seams Liaison Committee (SLC).

Marcus Hawkins, executive director of the Organization of MISO States, said during a virtual meeting that the Rate Pancaking Working Group’s (RPWG) strawman has been tweaked since its initial draft. It includes four recommendations for the SLC’s consideration, or “next steps … you all could consider to further this work,” he said.

The working group identified the treatment of unreserved use charges for transmission configuration changes and emergency ties on the seam as its key issue. It suggested the SLC request both RTOs develop comparable treatment of unreserved use with criteria that is simple, fair and easy to administer, and to also comparably treat the billing of firm network reservations.

The RPWG also looked at the inability of market participants to obtain congestion hedges for firm transmission procurement. The group suggested the RTOs explain to regulators how firm transmission reservations should be obtained and the issues that prevent awarding hedges for firm service customers. The RPWG proposed asking stakeholders to share their experiences with procuring financial transmission rights and whether it affected resource procurement, and to monitor SPP’s work on counterflow optimization.  

The grid operator has scheduled a virtual workshop Aug. 30 to discuss adding counterflow optimization to its market mechanism that hedges load against congestion charges. SPP and its stakeholders have been unable to reach consensus on the initiative, which began in 2019. The RTO still hopes to bring a solution to the October board meeting. (See “Counterflow Optimization not Dead Yet,” SPP Board of Directors/Markets Committee Briefs: April 26, 2022.)

The RPWG’s other findings and recommendations included:

  • Investigate how rate pancaking can be eliminated or reduced for long-term contracts, beginning with consideration during the Nov. 9 Common Seams Initiative joint stakeholder meeting of a long-term interregional rate that can reduce pancaking costs and increase revenue generated. The group suggested hearing from SPP on its rate-pancaking initiative and from MISO on whether it has any strategic actions related to the seams, and to request the RTOs assess different ways to adjust rates on the seams and increases transmission service sales.
  • Determine how interregional projects can cause unintended pancaking issues. The group advocated that during the next SLC meeting, the grid operators describe how the projects could change flows on the system and corresponding charges for load that didn’t exist before.

The SLC formed the RPWG to inventory rate pancaking along the grid operators’ seams. The group surveyed staff and stakeholders in developing their recommendations.

Wind Energy Market Sees Rising Penetration, Falling Value, DOE Reports

Like solar, wind generation in the U.S. faces a challenge of rising penetration and falling value on the grid.

Wind energy power purchase agreement prices are still trending below natural gas prices, according to the Department of Energy’s 2022 Land-Based Wind Market Report. But “the regions with the highest wind penetrations (SPP at 35%, ERCOT at 24% and MISO at 12%) have generally experienced the largest reduction in wind’s value relative to average wholesale prices,” the report says.

For example, the wholesale market value of wind in SPP in 2021 was $19/MWh versus $46/MWh for “24/7 flat profile” generation.

DOE released three wind energy market reports on Aug. 16 — one each on land-based, offshore and distributed resources — which together provide a view of the push and pull of forces now shaping the growth of the industry in the U.S.

The land-based report shows that while the solar industry is addressing intermittency issues with a growing number of hybrid solar and storage deployments — 67 new projects in 2021 — only two wind-and-storage projects were added to the grid last year.

Further, wind-and-storage hybrids are not providing the same capacity and flexibility as solar-and-storage. “The average storage duration of these [hybrid wind] projects is 0.6 hours, suggesting a focus on ancillary services and limited capacity to shift large amounts of energy across time,” the report says.

Offshore

A similar push-and-pull can be seen in the unprecedented $4.37 billion paid for six offshore wind leases in the New York Bight auction in February. While the sale was widely seen as demonstrating the intense interest in offshore development, it also triggered concerns about the impact of those high prices — estimated at $763/kW — on consumers’ electricity bills, according to DOE’s 2022 Offshore Wind Energy Market Report. (See Fierce Bidding Pushes NY Bight Auction to $4.37 Billion.)

Offshore Wind Pipeline (DOE) Content.jpgCapacity for “Permitting” and “Site Control” categories are assigned to the state where the wind energy area (WEA) is geographically located. All other categories are assigned to the state where the power will be delivered. | DOE

In response, the U.S. Bureau of Ocean Energy Management changed the auction rules for its May offshore auction, for two sites off the coast of the Carolinas, which sold for a modest combined total of $315 million. (See North Carolina OSW Auction Nets $315 Million.)

The “multifactor” bidding rules discounted prices by providing credits for up to 20% of the total sale amount to bidders committing to workforce or supply chain development as part of their projects. A similar multifactor approach will be used for upcoming Pacific Coast offshore wind auctions, the report says.

Driving down costs will be a continuing challenge for offshore wind, with DOE reporting global levelized costs for fixed-bottom projects in 2021 ranging from $75/MWh to $116/MWh, versus a U.S. average of $32/MWh for onshore wind. Adding to cost pressures in the U.S., the report says, “the [offshore] industry will need to tackle new technical challenges, such as hurricane survival, deeper water and lower average wind speeds.”

Onshore

While the U.S. onshore wind market continues to grow, with a total capacity of 136 GW by the end of 2021, the country still lags behind a number of European countries — including Denmark, Spain, Germany and the U.K. — which each get more than 20% of their power from wind.

2021 was also a year of contraction for the U.S. market, according to the land-based report. New onshore capacity grew by 13.4 GW last year — a 20% drop from the 16.8 GW installed in 2020 — but still enough to keep wind as the second-largest source of new generation on the U.S. grid. Solar was No. 1 at 45% of new generation with wind power following at 32%.

The domestic supply chain also contracted, with blade manufacturing taking a 50% nosedive as three U.S. manufacturing plants closed or idled, the report says. Like the solar and storage industries, wind relies heavily on imports, which were worth $3.1 billion last year, with Mexico, Spain and India the country’s key suppliers.

The U.S. market also relies on four turbine manufacturers, with only one — General Electric — homegrown, according to DOE. The others are Vestas, Siemens Gamesa Renewable Energy and Nordex.

Like solar, domestic wind is being slowed by projects caught in RTO and ISO interconnection queues. DOE reports 247 GW of wind are currently waiting for interconnection.

More promising, in terms of future growth, the market is diversifying in terms of who owns, sells or is buying wind-generated power. Utilities accounted for 44% of new wind power on the grid last year, but direct retail purchasers, including corporations, were close behind, with 35%. Merchant or quasi-merchant projects, with revenues tied to short-term contracts or wholesale spot markets, made up another 7%.

Distributed Wind Energy

DOE also reported its latest data on the distributed wind energy fleet, which totals 89,000 turbines with a nameplate capacity of 1,075 MW.

Distributed Wind Capacity (DOE) Content.jpgIowa and Minnesota, which have strong wind resources and active project developers, have received a significant number of U.S. Department of Agriculture Rural Energy for America Program wind grants, DOE says. | DOE

In 2021, 15 states added 1,751 turbines totaling 11.7 MW, representing a $41 million investment, about 75% of which was installed in Rhode Island, Kansas and Minnesota. That was a drop from the 21.9 MW ($44 million) added in 2020 and 20.4 MW ($59 million) added in 2019.

Of the 11.7 MW added last year, 8.7 MW came from projects using large-scale turbines (greater than 1 MW), while 1.2 MW came from mid-sized turbines (101 kW to 1 MW) and 1.8 MW came from small wind turbines (up to 100 kW). DOE said small turbine manufacturers are reporting that potential customers are increasingly expressing interest in microgrids or hybrid systems.

Distributed wind energy caters to a diverse group of customers, including military operations, municipal water systems, prisons, parks and tribal governments. In 2021, utility customers accounted for 56% of the total distributed wind capacity, while agricultural customers accounted for 56% of the total number of new projects installed. Between 2012 and 2021, 90% of the distributed wind projects were interconnected for on-site use, while the remaining 10% served local loads on distribution systems.

Although distributed wind occupies a tiny niche now, the National Renewable Energy Laboratory’s Distributed Wind Energy Future Study says it has an economic potential of 919 GW behind the meter and 474 GW in front of the meter.

“The projections increase substantially in a 2035 scenario that includes more policy support, namely the extension of the federal investment tax credit and relaxed siting conditions,” DOE said.

NJ Faces Challenges as Solar Sector Hits 4 GW

New Jersey’s solar sector will need to significantly ramp up the pace of installations to reach the state’s goal of 12.2 GW by 2030, even after a growth spurt in the first half of 2022 that helped the state reach an installed capacity of 4 GW.

The New Jersey Board of Public Utilities (BPU) said it expects to reach the goal by nearly doubling the annual installation capacity to about 750 MW though 2027. That will be achieved through the implementation of a permanent community solar program, replacing the current pilot, and the launch of a new program approved by the board last year to support the development of grid-scale solar projects, spokesman Peter Peretzman said.

The state’s ambitious solar goals, set out in Gov. Phil Murphy’s Energy Master Plan, call for New Jersey to install 5.2 GW of capacity by 2025, add another 7 GW by 2030 and reach 17.2 GW by 2035.

Data released by the BPU last month showed that the state added 195.2 MW of capacity in the first six months of the year. If it continues to add capacity at that pace through 2022, the state would add 390.4 MW in total, the highest amount in a year since 2019, when it added 453 MW.

The acceleration in installation follows a dramatic increase in the state’s solar project queue: from 523 MW in January 2021 to 1.6 GW a year later. BPU officials said in March that they expect the elevated capacity to be converted into strong installation figures this year. (See NJ Solar Pipeline Surges While Installations Drop.)

In a statement released last month to mark the state’s achievement of 4.03 GW, BPU President Joseph Fiordaliso called it a “significant milestone” in the sector’s development.

“New Jersey has been a leader in solar, and our solar initiatives are a key part of our clean energy future,” he said. The release predicted that the state’s solar capacity would “double in the next four years.”

Yet the figures also highlight how much the state will have to do to reach its goals. At an annual increase of 390.4 MW of new capacity, the state would surpass the 2025 goal but fall far short of the 2030 goal, reaching only about 7.5 GW. And even if the state does install 750 MW/year, as the BPU hopes, the sector would fall short of both targets.

The BPU said the fourth quarter of the year is usually a strong one, so the annual installation total for 2022 may be slightly higher than an estimate based on present figures. Yet much of the capacity needed to reach 750 MW will come from new programs, according to agency calculations, coupled with what Peretzman called “an extremely strong 2022.”

“This strong performance from the residential and smaller [commercial and industrial] sectors is expected to continue,” he said in an email. He added that the installation pace would especially pick up once the “federal incentives under the Inflation Reduction Act kick in.” (See Biden Signs Inflation Reduction Act.)

Scott Elias, senior manager of Mid-Atlantic state affairs for the Solar Energy Industries Association (SEIA), said it is “amazing” that New Jersey has reached 4 GW but said that it has nevertheless lost ground in recent years compared to other states.

That decline was demonstrated in the Solar Market Insight Report, compiled by SEIA and Wood Mackenzie and released earlier this year, which showed New Jersey falling significantly in national rankings based on megawatts installed per year. In 2019, the state took the No. 9 spot but dropped to 12 in 2020 and 20 in 2021.

“We don’t yet know the results for 2022,” Elias said in an email. “But that trend appears likely to continue. New Jersey needs to increase annual installation rates, not decrease them, or it will risk falling short of Gov. Murphy’s Energy Master Plan.”

New Program Capacity

The aim of the permanent community solar program, which the BPU expects to be in place next year, is to install 150 MW of capacity a year, though it could take a while to see those projects in action.

The BPU has awarded 150 projects totaling 240 MW in the two phases of the pilot program. But three years after the first batch was approved, the state has only installed 17 projects totaling 35.6 MW (as of the end of June).

The board earlier this month celebrated the completion of the first project in the second phase, a 500-kW installation covering the six roofs of a storage facility in Neptune Township. But solar projects across the nation have struggled with supply chain issues in the aftermath of the COVID-19 pandemic, and developers say getting municipal approvals has sometimes been slow in New Jersey. (See NJ Celebrates Completion of First Phase 2 Community Solar Project.)

The BPU hopes that a sizable chunk of future installed capacity, about 300 MW, will come from the Competitive Solar Incentive (CSI) program, which it approved in July 2021 as part of a two-pronged reshaping of the Successor Solar Incentive Program (SuSI). Under CSI, developers of solar projects above 5 MW would participate in a competitive bid to set the level of payment they would receive for solar renewable energy credits (SRECs) for their projects. Both behind-the-meter and grid-tied projects above 5 MW could participate, and the BPU would rank the bids and award the incentives to the lowest bidder. (See NJ Hearing Debates 300 MW Competitive Solar Solicitation.)

Although the BPU has approved the program, the rules have yet to be put in place, and no auctions have taken place. The board expects to launch it in the last quarter of 2022. (See Proposed NJ Solar REC Program Wins Initial Support.)

“The CSI program is scheduled to procure 300 MW of solar as part of one large competitive solicitation,” Peretzman said. “In other words, this single auction, scheduled to launch later this year, will procure almost as much new solar as all of the board’s other programs combined. These larger projects have longer development timelines, so this capacity is expected to come online over the next few years.”

He said the board also expects to see installation growth from the second element of the SuSI program, known as the Administratively Determined Incentive (ADI) program. Under this program, the BPU sets the incentive levels for net-metered residential projects, net-metered nonresidential solar projects of 5 MW or less, and community solar projects.

The incentive levels — ranging from $70 to $100, depending on the type of project — are lower than in the past. But BPU officials said that after years of the state nurturing the sector, there is enough demand for the state to stimulate new projects at the recast incentive level.

That program should also eventually generate 300 MW of installation year, adding to the existing increase in the state’s installation performance, Peretzman said.

NYISO: $1.5B in Tx Upgrades Needed to Deliver 2021 Class Year

About 40% of the proposed capacity seeking interconnection in NYISO’s class year 2021 is not deliverable without expensive transmission upgrades, the ISO told the Operating Committee Aug. 18.

To obtain capacity resource interconnection service (CRIS) — required for projects to participate in the NYISO’s wholesale capacity market — projects must be found “deliverable” at their requested CRIS level. If a project fails the applicable deliverability tests, system deliverability upgrades (SDUs) are required to obtain CRIS. Projects can proceed without committing to accept SDUs if they are willing to participate only in the ISO’s energy market.

The ISO’s Facility Studies Preliminary Deliverability Analysis Draft Report, which was approved by the committee Thursday, estimated that if all projects in the 2021 Class Year accept their cost allocations in the initial decision round, almost $1.5 billion in upgrades would be required for the 16 projects found not deliverable, 10 of them on Long Island.

If all 10 of the projects on Long Island proceed, the SDUs would cost an estimated $914 million (±50%) in upgrades, including two phase angle regulator (PAR)-controlled 138-kV lines, uprating of six 69-kV lines, and addition of a third circuit between the EGC tap and Valley Stream 138-kV line.

Five solar projects in the Thousand Island area near the St. Lawrence River that failed the deliverability test would require an estimated $200 million (±50%) to rebuild 25 miles of the Taylorville-Boonville lines 5 and 6 if all five projects proceed with their requested CRIS.

The 650-MW Swiftsure Energy Storage project in New York City would need to commit to funding an SDU, including a PAR-controlled 345-kV line between the Goethals 345-kV station and the W. 49th Street 345-kV station, at an estimated $382 million (±50%), to obtain CRIS.

Developers whose projects failed the deliverability tests have been given 10 days to decide whether to proceed to additional SDU studies, which would provide binding cost estimates.

The 2021 class year included 55 projects totaling 10,148 MW that requested CRIS, including seven wind projects totaling 3,076 MW; 22 solar projects (2,650 MW); 23 energy storage projects (2,902 MW); and one 270-MW solar/storage hybrid project. Also in the class were two projects related to the Champlain Hudson Power Express’s plans to inject 1,250 MW at the New York Power Authority’s Astoria Annex 345-kV substation.

New York City (Zone J, 13 projects, 2,818 MW), Long Island (Zone K, 10 projects, 2,867 MW) and the Central area (Zone C, seven projects, 785 MW) had the majority of the projects.   

Interconnection Study Process Questioned

The ISO’s review of the reliability impact study for an 80-MW solar project seeking to connect to a 115-kV line on National Grid’s Niagara Mohawk Power (NYSE:NGG) system prompted questions about the grid operator’s study processes from Operating Committee Chair Matt Antonio, an operations manager at National Grid’s control center.

The Tabletop Solar Project (queue #869) would connect on the Clinton Substation-Clinton Tap 115-kV line in Montgomery County, N.Y.

The ISO found the project caused N-1-1 thermal overloads and N-1-1 over- and under-voltages in the study area. The thermal overloads were fully mitigated by re-dispatching the generation at the Moses-Saunders dam on the St. Lawrence River. The high-voltage violations observed were mitigated or brought to pre-project voltages by turning on a reactor at Coopers Corner. The low-voltage conditions observed were mitigated by changing the tap positions of Rotterdam transformers 7 and 8 and the Inghams PAR after the first level contingency.

“I don’t believe that [the report] reflects reality, and how the system would actually be operated,” said Antonio. Re-dispatching Moses-Saunders “may be an answer, but it isn’t necessarily the answer that would be taken in real-time.”

Antonio also questioned the report’s finding of an instability problem, which the ISO ultimately determined was present in the pre-project base case. He said such reports should be subject to a “sanity check” before they are released to ISO members for approval. “The report was put out saying there’s a stability issue pre-project. So that’s worrisome,” he said.  

The ISO said the issue appears to be a modeling discrepancy in the pre-project case and agreed to investigate the modeling issue further.   

The ISO’s Thinh Nguyen said the grid operator didn’t find it necessary to hold off on Operating Committee approval of the study report, saying there was no need “to hold the project hostage” when the problem is with the base case and not because of the project itself. He said finding the cause of the modeling discrepancy is “like finding a needle in a haystack,” but committed to investigate it further to avoid confusion in future studies.

Antonio said he would like to see the ISO’s process “more streamlined … more thorough and more accurate.”

Nguyen closed the meeting by announcing that ISO officials will present plans for improving the interconnection process at the next Transmission Planning Advisory Subcommittee meeting Sept. 1.

He said the ISO improved its portal to increase the transparency to project stakeholders in April and is seeking to hire two project managers to provide “one-on-one service” to project developers. In addition, the ISO is seeking to add two stakeholder services representatives to help manage stakeholder inquiries related to the interconnection process.

Antonio asked if the ISO was attempting to shorten the process, saying National Grid must refer potential customers to the ISO for connecting loads larger than 10 MW. “It’s tough to explain to a customer, and occasionally they make the decision that New York isn’t the place for them because of how long it takes,” he said.

Nguyen responded that the ISO plans to “streamline the scope without jeopardizing the reliability of the system.”

Nevada Petition Seeks to Halt Utility Installation of LED Streetlights

Switching to LED streetlights can help cities reduce a significant source of greenhouse gas emissions, but an organization concerned about the health impacts of LEDs has petitioned Nevada regulators to halt installation of the streetlights.

An Oregon-based nonprofit, the Soft Lights Foundation, filed a petition last month with the Public Utilities Commission of Nevada. The petition asks PUCN to require Nevada utilities to wait for FDA approval of LED products before selling or installing LED streetlights.

“LED light has been shown to cause significant negative health effects,” said the petition, which was signed by Soft Lights President Mark Baker.

The petition also asks the commission to require utilities to include a warning on their websites about health impacts of LED lights and a statement that the lights are not FDA approved. Quoting state law, the petition said the commission has the authority to regulate utilities and has a duty to “protect, further and serve the public interest.”

In a response filed Aug. 17, PUCN staff recommended that the commission reject the Soft Lights petition, saying the group’s request “invites ad hoc rulemaking.” That’s the adoption of a regulation without following the state’s formal rulemaking requirements.

“No cause — even those pursued by the most devoted of supporters — justifies skirting NRS Chapter 233B [rulemaking requirements],” PUCN staff wrote.

PUCN staff also said that because the period to comment on the petition ended Aug. 17, any response filed by Soft Lights should be stricken.

In response, Baker tried to email commission members directly. In an email shared with NetZero Insider, Baker told commissioners that he expected PUCN staff to recommend further study of LED streetlights while following rulemaking procedures.

Baker also emailed state lawmakers to share Soft Lights’ concerns.

Growing Number of LEDs

As of 2018, there were 49.7 million street lighting systems installed in the U.S., and 24.2 million of those — or roughly half — used LED products, according to a 2020 DOE report. Before the emergence of LED street lighting, most streetlights in the U.S. used high-pressure sodium technology, DOE said.

Converting the remaining streetlights to LED would save an estimated 25.6 TWh of site electricity, the report said.

In Reno, a recent analysis found that streetlights account for 23% of the city’s GHG emissions. Switching to LED streetlights would reduce those emissions by 62%, according to a release this month from nZero, a company that partnered with the city to create a dashboard of the government’s GHG emissions.

The city owns about a quarter of the streetlights in Reno — around 2,700 lights — and most are now LEDs, according to Suzanne Groneman, the city’s sustainability program manager. The remaining streetlights are owned by NV Energy, which plans to convert them to LED over the next three to five years, Groneman told NetZero Insider.

Some cities are going a step further by pairing LED streetlights with smart controls, which allow them to dim the lights on a set schedule. LED streetlights with smart controls cut energy use by 60% to 80%, according to a release from RealTerm Energy and Ubicquia. The companies recently completed smart street lighting projects in 25 cities.

But Soft Lights Foundation contends that LED light is harmful, allegedly causing conditions such as migraines, seizures, anxiety and eye damage.

According to the Soft Lights petition, the Radiation Control for Health and Safety Act of 1968 directed the FDA to regulate electromagnetic radiation, including visible light emitted by electronic products. The FDA website says the agency’s Center for Devices and Radiological Health regulates devices, including cell phones, television receivers, microwave ovens, tanning booths and laser products.

But the FDA has yet to regulate LED lighting products, Soft Lights said in its petition.

Baker, who has a degree in electrical engineering, said he launched the Soft Lights Foundation “when LEDs started appearing everywhere.” Baker and the group’s members carry out the work of the foundation, which receives no funding, Baker told NetZero Insider. In addition to LED streetlights, another focus of the group is to “ban blinding LED headlights.”

In June, Soft Lights petitioned the FDA to regulate LED light products. The group has also submitted comments to the DOE regarding LED lights and filed a complaint with the Federal Highway Administration.

Similar to its petition filed with the PUCN, Soft Lights asked the California Public Utilities Commission in June to require FDA approval of LED streetlights. In a July 18 letter, Docket Office Supervisor Michael Oliveros rejected the complaint “because it fails to specify a violation of any law or any order or rule of the commission.”

Blue Light Controversy

As installation of LED streetlights started to accelerate, the American Medical Association in 2016 warned about “adverse consequences” of “improper LED technology.”

The AMA’s concern was focused on high-intensity LED streetlights that emit a large amount of short-wavelength blue light, which may increase nighttime glare and create a hazard for drivers. In addition, blue-rich LED light may disrupt sleep, the AMA said. The association recommended that communities shield LED lighting and use the lowest emission of blue light possible to reduce glare as well as health and environmental impacts.

The DOE subsequently sought to address “myths” about LED street lighting, noting that modern LEDs can be designed to emit less short-wavelength light if desired. Short wavelengths are “a key component of the visible light spectrum” that can enhance visibility, DOE said.

In addition, DOE said, LED systems can be adjusted to provide only the level of lighting needed.

‘Industry Standard’

In Nevada, NV Energy filed a response last week to Soft Lights’ petition regarding LED streetlights.

In NV Energy’s Northern Nevada territory, about 22% of company-owned streetlights, or 7,066, have LED bulbs. The company launched a program in 2018 to complete the LED conversion of its Northern Nevada streetlights within 15 years. NV Energy said it hasn’t yet converted any of its Southern Nevada streetlights to LED.

LED streetlights have become the industry standard, NV Energy said, and companies such as General Electric are discontinuing their supply of non-LED streetlight bulbs.

“As a result, limiting the companies’ ability to install LEDs as requested by Soft Lights will result in increased costs for the companies and its customers, and result in supply shortages that could lead to potential safety issues,” NV Energy wrote.

ERCOT Board of Directors Briefs: Aug. 16, 2022

Board Agrees to Lower Unsecured Credit Limit for Counterparties

AUSTIN, Texas — ERCOT’s Board of Directors last week unanimously eliminated unsecured credit limits for counterparties in the grid operator’s markets, rejecting stakeholder approval of a protocol change tabled since April.

The Technical Advisory Committee in April had modified ERCOT’s original nodal protocol revision request (NPRR1112) by reducing the unsecured credit limit from $50 million to $30 million, rather than cut the limit to zero. The grid operator then appealed that vote to the board in April, only to see it sidelined with a request for information on other RTOs’ unsecured credit practices. (See “ERCOT’s Credit Limits Align with Others,” ERCOT Technical Advisory Committee Briefs: May 25, 2022.)

According to ERCOT staff, the decision leaves the grid operator as the only one without unsecured credit limits between counterparties. ERCOT currently has $1.36 billion in outstanding unsecured credit.

Kenan Ögelman, the grid operator’s vice president of commercial operations, told the board during its Aug. 16 meeting that staff continue to recommend eliminating unsecured credit. Using unsecured credit moves credit costs from those receiving unsecured credit to the rest of the market and ultimately load, he said.

Ögelman also apologized for staff’s error during the June board meeting, when he said lowering the credit limit to zero would eliminate about $1 billion in the outstanding amount. “Actually, it was more in the $300 million range,” he said. (See “Maintenance Outage Scheduling Methodology Approved,” ERCOT Board of Directors Briefs: June 21, 2022.)

Kenan Ogelman Darrell Cline 2022-08-16 (RTO Insider LLC) Alt FI.jpg

ERCOT’s Kenan Ögelman (left) listens as Garland Power & Light’s Darrell Cline lays out TAC’s position on unsecured credit.  | © RTO Insider LLC

Darrell Cline, general manager for Garland Power & Light, advocated TAC’s position before the board. He said other “more appropriate” vehicles exist to target credit risk, pointing to NPRR1067, which sets market entry qualifications, continued participation requirements and credit risk assessments. The measure has been open since January 2021.

“Staff continues to believe that reducing unsecure credit is best for ERCOT. No other sophisticated markets allow for that,” interim CEO Brad Jones said, ticking off the Intercontinental Exchange, New York Stock Exchange and New York Mercantile Exchange as examples. “The very fact that the other” grid operators allow it is not “a compelling argument that we should do it as well. We know there’s a risk there.” He offered NPRR1067 as an opportunity to revisit the discussion.

The measure now goes before the Texas Public Utility Commission; it would become effective Oct. 1, 2023, allowing municipal utilities with fiscal years that end Sept. 30 to first close their books.

[EDITOR’S NOTE: An earlier version of this article incorrectly said that the board had reduced the unsecured credit limit to $30 million from $50 million.]

Staff Studying 17 GW of Crypto Load

ERCOT staff told directors that they are studying more than 17 GW of crypto mining load as it prepares its mid- and long-term forecasts.

Jeff Billo 2022-08-16 (RTO Insider LLC) FI.jpgJeff Billo, ERCOT | © RTO Insider LLC

Alluding to the Texas bitcoin rush, Jeff Billo, director of operations planning, said crypto load has grown since the studies began.

“Not all of that will be constructed, but the challenge is how much will be there in three to four years,” he said. “Midterm, it’s a challenge because [crypto load] is very price-responsive, more price-responsive than we have seen with other demand response in the past.”

ERCOT’s midterm load forecast uses two vendor models and five staff models to take an hourly look seven days into the future. It is updated hourly.

The long-term forecast uses one staff-developed model to provide an hourly forecast 10 to 30 years out and is updated annually.

Crypto miners have been drawn to Texas by its relatively low wholesale energy prices and because ERCOT pays industrial users to shut down during tight conditions. Their data farms typically use enormous amounts of power.

Billo said the amount of crypto load is not “constructive” to ERCOT’s planning models. He said staff are working with stakeholders to understand how much of it will show up. “We have to improve our processes to understand that behavior and build that into our model.”

The 2023 load forecast will be included in ERCOT’s December capacity, demand and reserves report, which projects 10 years into the future.

Directors Exert Control over Bylaws

The board’s Human Resources and Governance (HR&G) Committee agreed during its Aug. 15 meeting to modify ERCOT’s governing bylaws and other organizational documents, moving the authority for making future bylaw changes from corporate members to the directors and taking away members’ ability to veto the revisions.

Director Peggy Heeg, the committee’s chair, said that legislation passed last year after the February winter storm laid out “checks and balances” for ERCOT’s governance. She said it also required the PUC to approve all bylaws and their changes.

“While legislators and the governor clearly intended this board to have control over ERCOT, they were also very clear that corporate members are also valued contributors … and should have a voice in the bylaw-amendment process,” she said.

“It’s very clear from [the legislation] that this is what we’re directed to do,” board Chair Paul Foster said in agreeing with Heeg.

The committee urged the board to engage with members as it modifies the bylaws. Heeg also proposed the board to “move forward deliberately” in revising TAC’s reporting relationship and its structure.

“The market participants and corporate members have a very valuable place in contributing to this board,” Heeg said.

Under the suggested changes, members will still be able to propose amendments or comment on those under consideration. Board Vice Chair Bill Flores also said TAC will keep a seat at the table, “where it’s most valuable.”

ERCOT’s legal staff said it will take the board’s input and produce a redlined version of bylaw changes that can be shared with members. Their goal is to produce a final document by year-end for approval by the board and PUC.

Board Approves Tx Projects

The board approved two transmission projects with a combined capital cost of more than $760 million previously endorsed by TAC and recommended by the Regional Planning Group. (See “Members Endorse Two Tier 1 Transmission Projects,” ERCOT Technical Advisory Committee Briefs: July 27, 2022.)

The Bearkat-North McCamey-Sand Lake project in West Texas — consisting of two double-circuit, 345-kV transmission lines totaling about 165 miles — has an estimated cost of $477.6 million in 2021 dollars, up from $371 million in 2019 dollars. Oncor, Lower Colorado River Authority Transmission Services and Wind Energy Transmission Texas expect to complete the project in June 2026.

The Roanoke upgrade project north of the Dallas-Fort Worth area involves 7 miles of 138-kV lines, 26 miles of 345-kV lines, four 345/138-kV transformers and five 138-kV low-voltage buses. Oncor, the incumbent transmission service provider, expects to complete the upgrades by May 2025 at a projected capital cost of $285.9 million.

The projects are classified as Tier I builds because their costs exceed a $100 million threshold. Their status requires they receive TAC endorsement and the Board of Directors’ approval.

The directors also approved ERCOT’s proposal to change the reliability unit commitment cost-scaling parameter from 20% to 100%, effective Sept. 1. The grid operator’s greater use of the RUC process under its conservative operations posture this year has led to operators making many of their decisions outside of the process’s economic-based recommendations, leading to inefficient commitments.

The board also approved eight NPRRs, two other binding requests (OBDRRs), single revisions to the Planning Guide (PGRR) and the Retail Market Guide (RMGRR), and a system change request (SCR):

  • NPRR1085: changes the physical responsive capability calculation and dispatch’s validity by requiring quicker updates from qualified scheduling entities (QSEs) on telemetered resource status, high sustained limit and other relevant information.
  • NPRR1131: changes controllable load resource’s participation in non-spinning reserve from offline to online non-spin. The change sets a bid floor of $75/MWh, equivalent to generation resources’ offer floor when providing online non-spin. If a QSE also assigns responsive reserve (RRS) and/or regulation up service to a controllable load resource that has been assigned non-spin, the sum of RRS, reg-up and non-spin ancillary service resource responsibilities will be assigned a $75/MWh offer floor.
  • NPRR1133: clarifies the responsibilities of DC tie facility owners and operators for reporting DC tie model data.
  • NPRR1134: removes references to first available switch date (FASD) after recent mass transition/provider of last resort events indicated ERCOT’s use of FASD when processing switch transactions created an unintended negative experience for customers being transitioned from a bankrupt retailer.
  • NPRR1135: modifies the definition of real-time generation resources with an offline non-spin (OFFNS) schedule to allow non-zero values for the billing determinant only if the resource is offline when it telemetered OFFNS. This ensures an accurate settlement when an online resource erroneously telemeters OFFNS.
  • NPRR1136: adds clarifying language to the logic in place as fast frequency response is developed to ensure a QSE does not replace a regulation service with fast-responding regulation service.
  • NPRR1137: replaces the annual requirement to review the OBD list with a four-year review cycle.
  • NPRR1142: increases emergency response service’s (ERS) annual budget from $50 million to $75 million and gives ERCOT the ability to contract ERS for up to 24 hours in a standard contract term.
  • OBDRR040: removes the controllable load resource providing non-spin schedules and regulation service schedules from the capacity calculations to align with NPRR1131.
  • OBDRR042: increases the ERS annual budget and makes other administrative changes to the program.
  • PGRR101: clarifies that a DC tie’s owner will provide the appropriate dynamic model data to its tie operator, which will then provide the data to ERCOT.
  • RMGRR168: synchronizes ERCOT’s role and responsibilities with current market transactional solutions upon the removal of the “out-of-cycle” switch term and market process.
  • SCR822: creates a new daily integration report and dashboard for energy storage resources similar to the current wind and solar integration reports and dashboards.

FERC OKs GreenHat Settlements

The principals of GreenHat Energy will pay PJM almost $1.4 million to settle claims over the company’s spectacular default in the RTO’s financial transmission rights market, which cost members almost $180 million.

GreenHat founders John Bartholomew and Kevin Ziegenhorn will pay $375,000 and $400,000, respectively in disgorgement, with the estate of founder Andrew Kittell paying $600,000 under settlements approved by FERC in two orders Aug. 19 (IN18-9). Kittell died in January 2021.

Bartholomew and Ziegenhorn also agreed not to participate in FERC-jurisdictional markets for 10 years. “In the case of PJM markets, the agreed prohibition is permanent,” FERC said.

The GreenHat principals also consented to the entry of a judgment of $179.6 million against the company in a lawsuit pending in state court in Texas, but with the company insolvent, the judgment is moot.

“GreenHat and the [Kittell] estate state they are unable to pay the assessed amounts and have furnished confidential financial disclosures sufficient to substantiate their claim,” FERC said. “The agreed settlement amount is based on ability to pay in light of financial information provided by the estate and GreenHat to [FERC’s Office of] Enforcement.”

The disgorgements by Bartholomew  and Ziegenhorn also were based on their ability to pay, FERC said.

The three founded GreenHat in 2014 to trade FTRs in PJM, eventually acquiring a portfolio of 889 million MWh. When the company defaulted in June 2018, however, the company had less than $560,000 in collateral with PJM. (See Doubling Down — with Other People’s Money.)

“Over the next three years, GreenHat’s default required PJM to assess other members of PJM a total of $179,600,573,” FERC said.

Following an investigation, FERC assessed civil penalties of $179 million on the company and $25 million against the three principals, accusing them of violating the commission’s Anti-Manipulation Rule by purchasing FTRs with virtually no upfront cash, planning not to pay for losses at settlement and selling profitable FTRs to third parties. The commission said they also purchased FTRs based not on market considerations but to amass as many FTRs as possible with minimal collateral; they also made false statements to PJM about money purportedly owed by Shell Energy North America (NYSE:SHEL) to convince PJM not to proceed with a planned margin call. FERC said they also submitted inflated bids into an FTR auction in an attempt to inflate the clearing price of FTRs that Shell had purchased from GreenHat. (See FERC Levies $242M in Fines on GreenHat, Owners.)

Under the settlement, the principals did not admit or deny the alleged violations. GreenHat agreed to dismiss its lawsuit seeking more than $62 million from Shell in addition to the $13.1 million that Shell paid GreenHat in 2016 and 2017.

PJM and Shell also agreed to settle their billing dispute over Shell’s obligations to indemnify PJM over its FTR trades with GreenHat. PJM also agreed to drop a lawsuit it filed in California against the Kittell estate.

“This settles all pending litigation,” PJM spokesman Jeff Shields said Monday. “We appreciate FERC’s leadership on resolving these matters.”

Wash. High Court Shuts Down Cap-and-trade Challenge

Washington’s Supreme Court ruled Thursday that the state’s most prominent anti-tax activist cannot put a 2021 cap-and-trade law to a non-binding statewide public ballot. 

The justices ruled 7-1 that Tim Eyman filed his challenge to the state’s cap-and-trade program one year too late.  

Eyman has been a controversial anti-tax activist and fundraiser in Washington for the past 30 years. He is currently facing $5.4 million in fines and other penalties for numerous irregularities in his fundraising and campaign finances. Most of his anti-tax public ballot initiatives have failed or were disqualified because their language violated state laws. 

Eyman filed for bankruptcy in 2018 and a superior court judge ruled last year that he must liquidate his assets to pay the $5.4 million. 

Washington’s legislature passed a law creating the nation’s second cap-and-trade program in the spring of 2021. (See Wash. Becomes 2nd State to Adopt Cap-and-trade.) Eyman argued that the new program represents a tax, which state law requires to be put to a public non-binding advisory vote in the first election after the bill is passed. That would have translated to a November 2021 public ballot. 

But neither Eyman nor anyone else called for a public ballot on the bill in 2021, when opponents of the program still had legal standing, the Supreme Court’s ruling said. 

Eyman earlier this year filed suit calling for a public ballot on the cap-and-trade law to be held in November. A Thurston County Superior Court judge provided a temporary restraining order preventing the state from printing its voters’ pamphlets for the upcoming election, pending resolution of the litigation. The state immediately appealed to the Supreme Court to get a quick resolution.