Search
`
November 14, 2024

Big Offshore Wind Plans Face Multiple Major Obstacles

Two recent reports quantify the rapid growth of the U.S. offshore wind sector, while a third flags technical and reliability challenges posed by the ever-larger scale of turbines being installed.

There are just seven turbines spinning in U.S. waters, but thousands more are being planned. The American Clean Power Association’s (ACP) May 2023 Offshore Wind Market Report puts the U.S. development pipeline at nearly 51,400 MW, while the Business Network for Offshore Wind’s (BNOW) first-quarter report puts the combined goals of oceanfront states at 83,900 MW.

OSW Equipment Comparison (GCube Insurance) Content.jpg A comparison shows the growth of offshore wind equipment through the years. | GCube Insurance

Meanwhile, GCube Insurance in its second-quarter report this month warned that the latest-model high-capacity wind turbines favored by many developers are showing an unprecedented number of component failures, mechanical breakdowns and serial defects.

And the National Offshore Wind Research and Development Consortium in an April update of its road map points out a shortage of operational experience and data that could guide development of the large turbines planned for U.S. waters.

The potential consequences of this concurrent push for size and speed are that standardized, modular construction and the resulting economies of scale become hard to achieve and that quality control suffers.

This has been flagged many times by stakeholders, analysts and manufacturers. But taken together, the spate of recent reports provides a new look at the issue with fresh data.

Big Plans

The U.S. is very late to the offshore wind sector.

Thirty-two years after the first offshore wind farm went online in Denmark with a 5-MW capacity rating, worldwide installed capacity is 63,200 MW, with just 42 MW of it in U.S. waters. But the country is trying to make up for lost time to reduce greenhouse gas emissions and limit harm to the environment. President Joe Biden has set a national goal of 30 GW of offshore wind capacity installed by 2030 and 15 GW of floating offshore wind by 2035.

Major logistical hurdles stand in the way of the first goal: Domestic infrastructure and capacity to fabricate and install 2,000 fixed-bottom wind turbines are virtually nonexistent, and today’s grid cannot carry all those electrons.

But U.S. developers and regulators can at least draw on the body of knowledge gained from the 63 GW of fixed-bottom wind power in foreign waters. There is no such operational history with floating wind.

ACP’s report notes there are now 32 offshore wind leases in active development nationwide, with 18 projects in early development and 18 in advanced development. They total 51,377 MW of nameplate capacity, 938 MW of which is now under construction.

Most of this is on the East Coast: New York and New Jersey lead the nation with 4,362 MW and 3,758 MW in their pipelines, respectively.

In its report, BNOW notes that numerous infrastructure upgrades and manufacturing expansions are being undertaken to help make all the megawatts envisioned a reality. It also notes that the federal government this year moved to streamline the yearslong review process for development.

So far, the only records of decision issued by the U.S. Bureau of Ocean Energy Management have been for the two projects totaling 938 MW now under construction: Vineyard Wind 1 and South Fork Wind off the New York/New England coast, which are both expected to come online this year.

Big Turbines

In this environment, and with costs spiraling, developers and manufacturers are trying to squeeze as many watts as possible out of each turbine to maximize return on investment.

One notable example: Avangrid in September said it was pushing the completion dates of its Park City Wind and Commonwealth Wind projects back one year to 2027 and 2028, respectively, in hopes that next-generation 17- to 20-MW turbines would be available in time. It said the cutting-edge turbines it would be installing in Vineyard Wind 1 in 2023 can produce only 13 MW.

Some observers warn that this continual upscaling creates the risk that nothing ever really moves beyond the prototype stage; designs would be continuously being tweaked, upgraded and replaced.

GCube in its report said the largest turbines in production five years ago were rated at 8 MW.

SG 14-222 DD Turbine (Siemens Gamesa) Content.jpgThe Siemens Gamesa SG 14-222 DD offshore wind turbine has a capacity of up to 15 MW. | Siemens Gamesa

Now, the major Western manufacturers — General Electric, Siemens Gamesa and Vestas — are all sniffing around 15 MW with their largest prototypes. In China, China Three Gorges and Goldwind have produced a 16-MW unit, and CSSC Haizhuang laid claim to the world record with an 18-MW monster whose rotor sweep spans 13 acres.

Fresh off December certification of its Haliade-X turbine for 14.7-MW operation, a GE executive told investors in March the company is preparing a variant that will produce 17 to 18 MW.

The GCube report — titled “Vertical Limit: When is Bigger not Better in Offshore Wind’s Race to Scale?” — asserts that while this relentless upsizing has sharply reduced the cost of wind power and sharply increased the amount of power produced, there are negative consequences:

  • manufacturers competing for market share sign contracts for next-generation equipment years before it goes into production, sometimes without fully understanding the necessary processes and pricing;
  • with ever-evolving technology, every project can have its own unique learning curve;
  • turbines are becoming obsolete only a few years into a projected 25- to 30-year lifespan, and replacement parts are sometimes unavailable;
  • maintenance and repairs are incrementally more difficult, costly and time consuming as machines get larger;
  • support infrastructure has trouble keeping up — only three vessels in the world can install the newest 15-MW turbines; they cost up to $2 million a day to charter; and they are booked for years to come; and
  • insurance claims are escalating, but insurers, eager to burnish their environmental, social and corporate governance credentials (ESG), continue to enter the offshore wind market.

GCube, which insures 100 GW of renewable energy projects in 40 countries, analyzed a decade of proprietary data and determined that offshore wind claims increased significantly in frequency and severity over the decade from 2012 to 2021, with turbine component failures increasing sharply after 2017.

It also found that as a proportion of total claims, larger turbines are generating more claims during construction than their smaller, older cousins did. Then, once installed, turbines larger than 8 MW are sustaining component failures much sooner than smaller units.

In a May 2 announcement, GCube CEO Fraser McLachlan presented the study and its data as a cautionary tale.

“The push to rapidly develop more powerful machines is piling pressure on manufacturers, the supply chain and the insurance market,” he said. “Scaling up is an essential part of driving forward the energy transition, but it is now creating growing financial risks that pose a fundamental threat to the sector. We advise manufacturers to focus on improving the quality and reliability of a reduced number of products to put themselves back on a sustainable path of development.

“At the same time, developers must support manufacturers by sharing the risk of larger machines more equitably and open their lending books to supply chain companies.”

Recurring Message

The GCube report’s warning of too much, too fast is a message expressed in different ways for different reasons by both opponents and proponents of offshore wind.

In an email to NetZero Insider, BNOW wrote of the climate and economic benefits of this rapid technological evolution but also flagged some concerns.

“The scale and speed of the technological advancement, however, is challenging for the supply chain to keep pace, let alone expand to meet rising demand,” the organization wrote. “Standardization and optimization are keys to creating more supply chain capacity, ensuring deployment goals are met and even further driving down costs, but those benefits must be weighed against fostering innovation in this still evolving industry.”

The National Renewable Energy Lab told NetZero Insider there would be greater value in industrializing at the current scale than in upscaling beyond 15 MW. NREL in its January offshore wind supply chain road map said it expected some modularity to evolve in design and construction of turbine nacelles. But it also saw the potential upscaling of nacelles from 600 tons to nearly 1,000 tons.

The R&D Consortium in Version 4.0 of its road map last month said operations and maintenance costs constitute more than 30% of the cost of offshore wind, and it is imperative to control those costs at the design stage.

However, it noted, there are few test facilities that can accommodate components on the 15-MW scale and no record of operations data from which to draw insight, as 15-MW turbines are so new.

“The offshore wind industry has been focused on turbine megawatt upscaling, but optimization of the current generation of 15-MW turbines for performance and load reduction has been compromised as a result,” the report noted. “The consortium does not envision direct support of new turbine development. Rather, acceleration of turbine optimization solutions in harmony with the needed industrialization and standardization of the supply chain would better serve U.S. development.”

It is likely, the consortium added, that maintenance systems and protocols for 15-MW turbines will be developed and proved in U.S. waters.

Quality Control

One after another in the past year, the major turbine manufacturers have acknowledged sharply escalating quality-control problems and warranty claims in their wind power products. To judge by their statements to investors and analysts, they have already embraced some of the points in the GCube report.

Haliade-X 14.7MW-220 Turbine (General Electric) Alt FI.jpgThe GE Haliade-X 14.7MW-220 offshore wind turbine prototype is shown in Rotterdam, Netherlands. | General Electric

In an October 2022 earnings call, GE CEO H. Lawrence Culp Jr. spoke of the warranty costs that were a drag on the financials of GE Renewables and blamed some of that on rapid product development over the preceding five years.

“Such rapid innovation strains manufacturing and the broader supply chain,” he said. “It takes time to stabilize production and quality on these new products, which in turn pressures fleet availability. We need to industrialize faster to counteract these dynamics, and we are.

“We’re drastically simplifying and standardizing too many variants into what we call workhorse products, so we and our suppliers can implement more repeatable manufacturing processes. This enhances product quality and reduces cost. In our existing fleet, we’re deploying corrective measures, enhancements and monitor-and-repair programs.”

Vestas reported in February that lost production factor — the measure of energy production not captured by the 56,400 wind turbines under its service — has been rising steadily for several years, surpassing 3% by the end of 2022. Warranty costs equaled 6.3% of Vestas’ 2022 revenue.

“Lost production factor continues at high level as a consequence of the extraordinary repair and upgrade level,” it said in a quarterly report May 10, but the numbers were better: Warranty costs equaled only 4% of first-quarter revenue, compared with 7.8% in the first quarter of 2022.

“Optimizing the complete value chain calls for increased focus on improving our existing platforms,” Vestas said in its annual report. “We believe strongly in this approach, because introducing new platforms too fast obstructs supply chain industrialization. As turbine components become larger and more efficient, they also create logistical challenges to the expansion of wind power around the world. For this reason, we are paving the way for scale through modularization and optimizing how our products are designed and produced.”

And in a quarterly report to investors in February, Siemens Gamesa wrote, “Service performance during Q1 [2023] was severely affected by the outcome of the periodic monitoring and technical failure assessment of the installed fleet, which revealed a negative trend in the failure rate of certain components. As a result, the estimated cost of fleet maintenance and warranty provisions is higher than initially estimated.”
Hydro, New Resources Boost CAISO’s Summer Outlook

CAISO’s summer forecast looks better than last year’s thanks to the addition of thousands of megawatts of new resources and California’s record snowpack, which is expected to increase hydroelectric generation by 72% compared with drought conditions a year ago.

In its annual Summer Loads and Resources Assessment, published Tuesday, the ISO says it has made “sound progress towards meeting the conventional ‘one day every 10 years’ loss-of-load expectation planning target.”  

“Under current high hydro conditions, the resource fleet scheduled to be online by June 1, 2023, exceeds the one-in-10 planning target with a margin of approximately 200 MW … [and with] the resource fleet scheduled to be online by Sept. 1, 2023, exceeds the one-in-10 planning target with a margin of approximately 2,300 MW,” the assessment says.

That compares with a 1,700-MW shortfall in meeting the planning target last year, CAISO management says in a slide presentation on the assessment.

“These results do not take into account more extreme events such as those demonstrated in the last several years, e.g., extreme drought, wildfires and the continued potential for widespread regional heating events and other disruptions that continue to pose a high risk of outages to the ISO grid,” it says.

California experienced energy emergencies caused by extreme heat and wildfires in the past three summers, when the state and much of the West endured worsening drought and decreased hydropower.

The ISO was forced to call for rolling outages in August 2020 during a Western heat wave that dried up imports. It declared an energy emergency in July 2021 when an out-of-control wildfire in Southern Oregon nearly shut down a major transmission pathway between California and the Pacific Northwest.

And it came within minutes of ordering blackouts during a record-setting heat wave in September 2022, when demand outpaced supply. (See CAISO Reports on Summer Heat Wave Performance.)

Since last summer, CAISO has been connecting thousands of megawatts of new battery and solar resources.   

By June 1, the ISO expects to have connected 2,500 MW of solar and 2,300 MW of batteries since Sept. 1, 2022. By September of this year, it expects to add another 1,300 MW of solar and 2,000 MW of batteries, bringing the totals to 3,800 MW of solar and 4,300 MW of batteries and (8,100 MW total) added since September 2022, CAISO says in its slide presentation.

In addition, a series of atmospheric rivers this winter filled the state’s hydroelectric reservoirs and pushed the snow water content to approximately 240% of average on April 1, a key date for California’s measurement of snowpack in the Sierra Nevada. The snow melted slowly in April thanks to cloud cover and below-normal temperatures, the state Department of Water Resources said. (May, however, has been hotter than normal, including in the Sierra.)

“The year-to-date snow water content totals are significantly above average, which should result in above-average hydro energy generation in 2023,” the ISO’s summer assessment says.

The assessment does not include a projection of the amount of hydropower that could be generated, but it notes that the state has large and small hydroelectric facilities with more than 7,900 MW of installed capacity.

In the unusually wet winter of 2016/17, large and small hydro generated more than 43,000 GWh of hydroelectric power, compared with about 14,500 GWh in the drought of 2021, a 66% decrease, California Energy Commission records show.

On May 10, the U.S. Energy Information Administration forecast a 72% increase in hydropower generation in California this year compared to 2022.

“One source of uncertainty in our forecast is the possibility of warmer spring temperatures, which would melt the Sierra Nevada snowpack earlier than expected,” the EIA said. “In this case some of the melting snow may bypass power generating turbines for flood control purposes.

“Less snowpack also means less water available to supply hydropower plants during summer months, when electricity generation has historically been at its highest.”

CAISO management plan to present their findings to the Board of Governors at its meeting Thursday.

US, Canadian Officials Announce EV Corridor from Michigan to Quebec

Senior officials from the U.S. and Canada were in Detroit on Tuesday to announce the first Binational Electric Vehicle Corridor, which will stretch from Kalamazoo, Mich., to Quebec City, Quebec.

The corridor will feature fast-charging stations every 50 miles along the roughly 900-mile stretch between the two cities. The announcement featured U.S. Transportation Secretary Pete Buttigieg, Michigan Gov. Gretchen Whitmer (D) and Canadian Minister of Transport Omar Alghabra.

“The U.S. and Canada have long enjoyed a productive partnership on transportation issues, and in that spirit we are proud to announce the first ever U.S.-Canada EV corridor,” Buttigieg said. “With historic investments in EV infrastructure from the Biden-Harris administration and the Canadian government, we are creating a new generation of good-paying manufacturing jobs, making it possible for drivers everywhere to reap the benefits and savings of these vehicles while helping us fight climate change.”

The Biden administration has a goal to have 50% of all new cars be electric vehicles by 2030 with support from the Inflation Reduction Act, Infrastructure Investment and Jobs Act, and CHIPS and Science Act, which have helped spur hundreds of billions of dollars in private-sector investment in EVs. The IIJA includes $7.5 billion in federal funding to help build a national network of 500,000 public EV chargers.

In Canada, one in 10 cars purchased is an EV.

Officials said the new binational corridor will help move passengers and goods along a key economic route.

“There’s nothing more ‘Pure Michigan’ than accidentally driving into Canada, and now that journey will be electric on either side of the border,” Whitmer said. “I am proud that we are working together to build up electric vehicle charging infrastructure. With the resources headed our way from [the IIJA] and the bold investments Michigan automakers are making right here in Michigan, we will build and lead the future of mobility.”

Michigan this month issued a request for qualifications seeking teams to design, build, operate and maintain EV charging stations across the state, the first part of its efforts to tap into $110 million through the National Electric Vehicle Infrastructure (NEVI) program. The deadline to submit applications is June 6.

In announcing the launch of the request, Whitmer said the program will help move NEVI funds into state communities to get the chargers set up efficiently.

Detroit also announced a change in its plans to roll out EV charging stations at 60 sites downtown and in recreation centers, saying the municipal government will lead the effort instead of leaving it to the private sector. The city is “going full bore” on EV charging development, Tim Slusser, Detroit’s director of mobility innovation, told Axios Detroit.

NY State Reliability Council Executive Committee Briefs: May 12, 2023

Operating Reserves

ALBANY, N.Y. — The New York State Reliability Council (NYSRC) Executive Committee on Friday indicated that the council’s Installed Capacity Subcommittee may increase the amount of 10-minute reserve assumptions from 350 MW to 400 MW in the next installed reserve margin (IRM) determination.

The NYSRC annually re-evaluates the state’s IRM and operating reserves requirements. NYISO’s summer net load variability, which used a new loss-of-load expectation window based on recently approved capacity accreditation requirements, was higher in some zones.

Inverter-based Resources Standard

The NYSRC received several questions and comments on its proposed rule establishing minimum requirements for inverter-based resources (IBRs) over 20 MW.

According to the NYSRC, the feedback will be reviewed to determine what changes, if any, should be made to the draft rule; if changes are made, it is likely the draft will be reposted for additional comments. The length of the posting and comment period will depend on the changes proposed. The council will publicly note if the comment period is reopened.

PRR-151 would establish standards for IBRs, as NYISO presently has no specific interconnection criteria for these resources. (See “Inverter-based Resources Standard,” NYISO Operating Committee Briefs: April 20, 2023.)

Stakeholder comments range from general questions on language, to more procedural or technical concerns about implementation, cost and new requirements.

The range of comments “reinforces that this a serious issue that we need to work through,” committee Chair Chris Wentlent said. He said he thought that New York “appears a bit ahead of our neighboring jurisdictions on implementation,” referring to a panel at the Independent Power Producers of New York’s Spring Conference last week that he participated in with PJM and ISO-NE staff. (See IPPNY Panelists Urge Collaboration, Coordination in Transition.)

Cap and Invest

Wentlent told attendees that the New York Department of Environmental Conservation (DEC) confirmed it would be taking the lead in implementing the state’s cap-and-invest program and plans to have draft regulations completed by the end of this year. The New York State Energy Research and Development Authority will assist.

Most details of the program have not been determined or announced by the DEC, but based on details in the state’s approved budget, it would charge companies for their carbon emissions to pay for clean energy projects and low-income utility payment assistance via an auction of credits. (See NY Budget Plan Details Cap-and-invest Proposal.)

Wentlent said he learned about the DEC’s intentions during a recent meeting he attended with it, the Department of Public Service and several other relevant agencies. He said that “realistically, [we’re] probably looking at a 2025 time frame” for the program to be implemented.

Study: Limited Exposure to Supply Shortfall for ISO-NE During Extreme Weather

WESTBOROUGH, Mass. — The preliminary results of a joint study by ISO-NE and the Electric Power Research Institute (EPRI) found that the risks of a supply shortfall in ISO-NE during extreme winter weather events are “manageable” through 2027, even without the Everett Marine Terminal and the New England Clean Energy Connect (NECEC) transmission line in service.

But the results also showed that while shortfall risks were similar with or without Everett because of counterbalancing factors, scenarios with the NECEC in service consistently showed less energy adequacy risk, as well as decreased magnitude of the shortfall when it did occur.

ISO-NE presented the results, focused on the projected impacts of extreme weather on grid reliability in the winter of 2027, to the NEPOOL Reliability Committee on Tuesday. The study is part of a larger project with EPRI looking at historical and projected extreme weather events in New England and modeling the risks these events pose to energy infrastructure and grid reliability.

The modeling assessed reliability both with and without Everett and the NECEC, two major sources of uncertainty for the region’s 2027 energy mix.

“In the near term, the energy shortfall risk appears manageable,” said Stephen George, director of operational performance, training and integration for ISO-NE. “The risks are mitigated by incremental imports from New England Clean Energy Connect.”

The research team produced the results from a series of severe weather scenarios based on historical data going back to 1950, adjusted for 2027 based on five climate models and two emissions pathways. For each modeled event, the analysts looked at 21-day energy analysis results from 720 individual cases that differed based on variables including forced outages, LNG inventory, fuel oil inventory, imports and fuel prices.

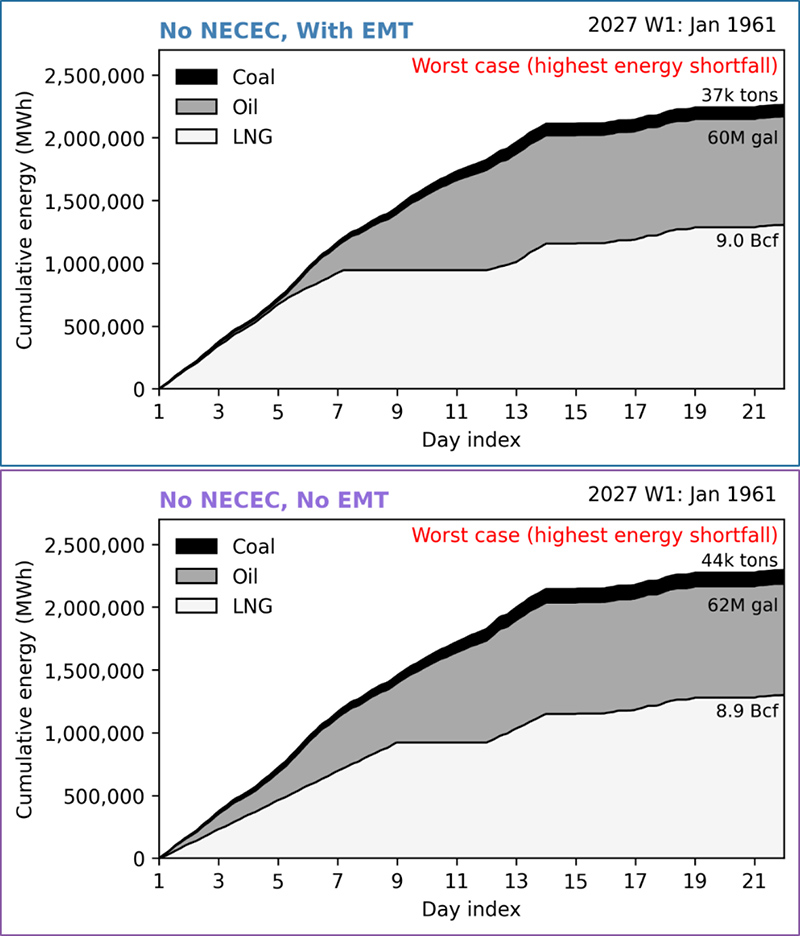
Expected energy from stored fuels in cold weather (ISO-NE) Content.jpgExpected energy from stored fuels used in a long-duration severe cold-weather scenario, with and without NECEC and EMT | ISO-NE

In the weather scenario with the highest average system risk — modeled after an extreme cold stretch in the winter of 1961, the coldest 21-day period since 1950 — the probability of an energy shortfall ranged from 0.64% (with the NECEC and without Everett) to 7.6% (without the NECEC and with Everett).

ISO-NE noted that some scenarios with the Everett terminal in service are projected to have increased shortfall margins and risks because of faster depletion of LNG. Scenarios without the Everett terminal projected an increase in burning fuel oil and coal.

George highlighted how this model could be built upon and refined to look at future reliability scenarios.

“This energy adequacy study framework provides a much-needed foundation to study the system as it continues to evolve,” George said. “The ISO will continually monitor the energy adequacy risk, particularly as the changes in the regional supply and demand profiles ramp up.”

The RTO a year ago presented the findings of EPRI’s extreme weather modeling, which were used as an input to produce the study results.

This earlier portion of the study found that the frequency of extreme heat has increased over the past century, while extreme cold has decreased. The study defined extreme heat as daily maximum temperatures above the 95th percentile and extreme cold as daily minimum temperatures below the 5th percentile.

The study also noted that in general, winter temperatures have increased faster than summer temperatures, though cold extremes remain more common than heat extremes.

EPRI projected that these trends will continue in the coming decades, accompanied by a modest increase in precipitation. Wind speeds also are projected to increase in some locations. The study found that scenarios with higher emissions would amplify warming trends, with impacts differentiating for extreme cold around 2040 and for extreme heat around 2050.

George said the RTO will continue to assess the outputs of the 2027 winter study. The organization is also working on projections for the summer of 2027, as well as for the summer and winter of 2032. It hopes to present the results for summer 2027 prior to FERC’s New England Winter Gas-Electric Forum on June 20.

Renewable Natural Gas Seen as Pathway to Low-carbon Hydrogen

Using renewable natural gas (RNG) as a feedstock offers hydrogen producers a shortcut to claiming the full federal tax credit created by the Inflation Reduction Act (IRA) to incentivize hydrogen production.

That translates into a tax credit of $3/kg of clean hydrogen produced, or 2.6 cents/kWh of power generated using that clean hydrogen as fuel.

RNG is made from landfill gas or from biogas produced by anaerobic digesters that process municipal sewage or animal manure. Indistinguishable from fossil-based natural gas, RNG is also now more valuable as a fuel itself because the IRA expanded the federal production tax credit (PTC) to include biogas projects that begin construction before 2025. Previously, the PTC applied to only wind and solar projects.

Even before the IRA passed last year, interest in biogas had increased among companies looking for ways to increase their environmental commitments by purchasing electricity made by biogas-powered generators or by purchasing carbon credits associated with biogas.

The potential for producing hydrogen by steam reforming RNG has burnished the image of biogas as an important, if interim, fuel that could be critical to boosting hydrogen production as the industry works to build the massive numbers of electrolyzers needed to make clean hydrogen from water and determine where along the nation’s grid to locate them.

The idea has sparked the interest of biogas producers, as evidenced last week when the American Biogas Council (ABC) organized a webinar to announce it had retained Iowa-based engineering company EcoEngineers to create an accounting methodology as a tool to help biogas producers understand carbon accounting in fuels.

About 1,000 organizations registered for the webinar, the highest ever for an ABC event, said Patrick Serfass, the trade group’s executive director.

Getting the Right Score

A day after the webinar, an EcoEngineers representative participating in an unrelated online biogas event sponsored by Spain-based ATA Insights explained the importance of carbon accounting to companies trying to qualify for a tax credit under the IRA.

“I’m sure most of us are aware that the carbon intensity score [of hydrogen] is key,” said Tanya Peacock, a managing director at EcoEngineers.

“One way of making sure that you can maximize the available value from all of these [federal] credits and incentives is to make sure that you design your projects to achieve, from the outset, your desired target CI score,” she said.

To receive the full tax credit, $3/kg of hydrogen produced over 10 years, a hydrogen producer must prove the technology used to make that single kilogram of hydrogen generates no more than .45 kilograms of CO2, she explained.

Most hydrogen produced today from natural gas uses high heat and high-pressure steam to break the molecular bonds of methane (CH4), releasing the hydrogen and allowing the carbon to combine with oxygen in ambient air. It’s a process that fails the strict CI score but could work financially, say some analysts, if that CO2 is captured and sequestered — or if steam methane reforming could be made more efficient.

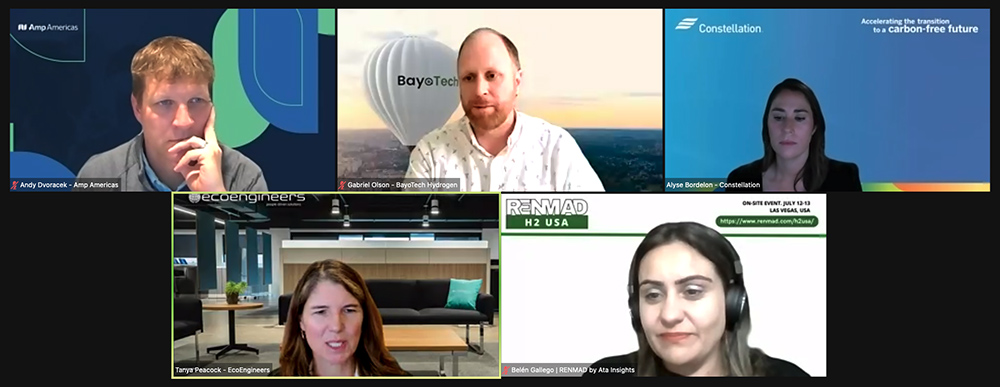
Hydrogen Panel (ATA Insights RENMAD Events) Content.jpgClockwise from top left: Andy Dvoracek, Amp Americas; Gabriel Olson, BayoTech Hydrogen; Alyse Bordelon, Constellation; Belen Gallego, ATA Insights; and Tanya Peacock, EcoEngineers | ATA Insights & RENMAD Events

Gabriel Olson, former innovation director at SoCalGas and now director of carbon strategy and head of hydrogen markets for Texas-based BayoTech Hydrogen, said his company produces hydrogen with steam methane reforming but uses 20% to 30% less energy, thanks to a modular steam methane reformer developed by Sandia National Laboratory.

More importantly, BayoTech also uses RNG rather than conventional fossil gas as a portion of its feedstock, making its hydrogen competitive, he said, adding that the process does not require 100% RNG.

Using 100% dairy-sourced RNG in the modular steam reformer produces hydrogen with a carbon intensity (CI) of -300, he said, well under the minimum CI required by the IRA.

“That might be amazing and impressive, but it’d be kind of expensive, because you’re using a lot of a deeply negative [CI] and a highly valuable feedstock,” Olson said. “What we do is more cost-effective,” by using a blend of 30% dairy RNG and 70% pipeline natural gas.

Value to Produce Hydrogen (The US Hydrogen Demand Action Plan EFI) Content.jpgThe value of federal tax credits to produce hydrogen will depend on the carbon emissions created to produce the hydrogen. | The U.S. Hydrogen Demand Action Plan, EFI

“We’re effectively able to [produce] a cost-effective hydrogen product that’s both valuable and eligible for the incentive credits that are available,” including the PTC, he said.

“We see RNG as kind of the linchpin for doing this cost-effectively,” Olson said. “There are other pathways — carbon capture and things like that. But RNG for us is the most cost-effective, and the most flexible in terms of deployment, for multiple facilities in multiple locations. We see it as a great way to offset the fossil natural gas that we typically use as a feedstock.”

‘Next Wave’

Another company with a similar strategy that should have little trouble meeting federal CI standards is Illinois-based Amp Americas, which began producing RNG in 2011 from cow manure as a fuel for an electricity producer but then turned to providing the gas to an Indiana dairy for use as a fuel in its delivery trucks. The company then began producing and selling dairy-based RNG as a motor fuel in California.

“In 2022, we produced 1.3 million BTUs of renewable natural gas from dairy manure. That’s about 11% of market share of total dairy gas produced in the United States. The gas has an ultra-low CI net … a -250 to -300 score,” said Andy Dvoracek, the company’s vice president of business development.

The calculation for that ultra-low CI rests on how much methane the company’s operation has prevented from entering the atmosphere had the manure not been converted to biogas in an anaerobic digester, Dvoracek said.

<img src=”//www.rtoinsider.com/wp-content/uploads/2023/06/140620231686776292.jpeg” data-first-key=”caption” data-second-key=”credit” data-caption=”Renewable natural gas made in an anaerobic digester from cow manure has a negative carbon score since the methane produced in the digester is captured and hydrogen produced from that methane qualifies for a maximum federal tax credit.” data-caption-html=”Renewable natural gas made in an anaerobic digester from cow manure has a negative carbon score since the methane produced in the digester is captured and hydrogen produced from that methane qualifies for a maximum federal tax credit.” data-credit=”

BayoTech Hydrogen

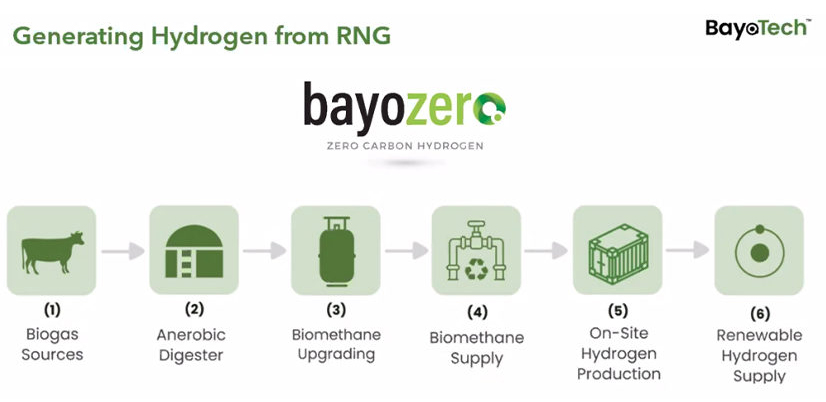
” data-description=”Renewable natural gas made in an anaerobic digester from cow manure has a negative carbon score since the methane produced in the digester is captured and hydrogen produced from that methane qualifies for a maximum federal tax credit.” data-id=”5548″ style=”margin: auto;” alt=”Generating-Hydrogen-from-RNG-(BayoTech-Hydrogen)-Content.jpg” data-uuid=”YTAtOTMwOTc=”>Renewable natural gas made in an anaerobic digester from cow manure has a negative carbon score since the methane produced in the digester is captured and hydrogen produced from that methane qualifies for a maximum federal tax credit. |

BayoTech Hydrogen


The company has 14 projects operating across the country and others in development.

“We think we’ll produce somewhere around 2.5 million metric tons of carbon dioxide abatement by 2027. We are about a half a million at a run rate right now. Collectively, we’ve got about 200,000 cows across the country that are producing this gas,” he said.

Most of that RNG is injected into pipelines and sent to states such as California and Oregon that have emphasized using the gas as a motor fuel for several years, he said. Revenues from the sale of the gas are augmented by renewable energy credits in the markets that developed under EPA rules. Called renewable identification numbers, the credits travel with the gas.

The company is now looking seriously at hydrogen.

“Hydrogen is an area of particular interest because hydrogen is seen as a next wave of energy usage in the transportation space, as well as just global energy transfer as a whole,” Dvoracek said.

Minimum Transfer Capability Between Regions Debated at FERC

Parties filing comments with FERC on expanding interregional transfer capability on the grid mostly supported the concept, though opinions were split on how to get there.

Due Monday, the comments came in response to a FERC technical conference on the subject late last year, and they could inform another Notice of Proposed Rulemaking in its broader efforts to revise transmission policy (AD23-3). (See FERC Considers Interregional Transfer Requirements.)

Many parties, including clean energy trade groups and environmentalists, want FERC to set minimum transfer requirements, based on either a flat megawatt amount or a percentage of peak load, between each neighboring region in the Lower 48 (except ERCOT, which was left out of the proposal as it is outside commission jurisdiction). Many of them pointed to a study by Grid Strategies that Americans for a Clean Energy Grid (ACEG) filed with its comments.

“Adopting a strong minimum requirement for Interregional Transfer Capability is the single most important step the commission can take to make the power system more reliable and resilient in the face of increasing threats from severe weather and other unexpected events,” ACEG said. “Interregional transmission is the most effective solution because the largest impacts from all of these threats tend to be localized in relatively small areas, so expanding interregional transmission provides a lifeline when a region’s electricity supply and demand is being affected by an unexpected event.”

Grid Strategies’ report, which looked into transfer capability among the Eastern Interconnection’s regions and ERCOT, found that all regions would benefit from a minimum transfer requirement of 20 to 25%. That would cut the need for peaking resources across the two interconnections by 137 GW.

“This 137-GW geographic diversity benefit translates to $113 billion in economic savings based on the avoided capital cost of an equivalent amount of gas combustion turbine capacity,” ACEG said.

Grid Strategies did not factor in likely changes such as the growth of renewables and increased electrification of home heating and other new sources of demand, or a growing reliance on natural gas plants — all of which would tend to increase the value of interregional transfers.

“Interregional transmission functions like an insurance policy against unexpected events, in that it is impossible to precisely predict when, where, or for what that insurance policy will be needed,” ACEG said. “Over the long term, all regions will be affected by such an event and will benefit from that interregional transfer capacity.”

Natural Resources Defense Council, Sustainable FERC Project, Rocky Mountain Institute, Environmental Defense Fund, Sierra Club and others said the need for more interregional transfer capacity has only grown since FERC’s December conference because of the outages in the Southeast around Christmas last year.

“Transmission can deliver electricity in both directions, so both connected regions benefit,” the environmentalists said. “For example, transmission flows flipped from westward to eastward as Winter Storm Elliott moved eastward across the country, as has happened during past severe weather events.”

Such minimum transfer capacity can be viewed as insurance against outages caused by extreme weather and thus should have its costs spread widely, they said. The industry likewise spreads the costs of resource adequacy widely because meeting the one-day-in-10-year resource adequacy standard is viewed as good for all, the environmentalists said.

The Department of Energy also filed comments urging FERC to move forward on increasing interregional transfers, highlighting that its own recent draft study on transmission needs found increasing needs for such transfer in some regions by 2030 and in nearly all regions by 2040. DOE is also working on a National Transmission Planning Study focused on interregional transmission, which is expected to come out by the end of 2023.

“Recent work shows that large amounts of interregional transmission coming online between now and 2030 will enable the economic and consumer energy cost reduction benefits of the significant investments in clean energy manufacturing and generation, and the electrification of homes, businesses, and vehicles made by the Infrastructure Investment and Jobs Act and the Inflation Reduction Act,” DOE said. “Recent modeling by the Department of Energy and NREL finds that between 17 and 36 TW-miles … of new transmission capacity will be needed between 2023 and 2030 to connect the vast amount of new generation and storage resources enabled by both laws.”

It would be possible to tailor transfer requirements between specific pairs of regions, but that entails factoring in weather and climate patterns, generation mix and location, load patterns, the gas pipeline network, and hard-to-predict extreme weather, ACEG said. That could lead to “analysis paralysis” and also does not factor in that different parts of an interconnection are impacted by power flows all across it, the group added.

DOE said FERC should base any standards on well-defined processes that take into account clearly defined planning assumptions such as demand, weather events, contingencies, geographic and temporal scope to ensure consistent results around the industry.

While some argued for the simplicity of setting a minimum transfer percentage that applies everywhere, others said FERC can take the time to have regional and interregional planners study the issue and come up with more tailored solutions.

Support for Improved Interregional Planning 

The Eastern Interconnection Planning Collaborative, which is made up of planning authorities from the interconnection and dates back to the last big push for interregional transmission 10 years ago, filed comments suggesting such a planning process. That process should involve DOE and the national labs, as well as the National Oceanic and Atmospheric Administration to quantify the needs addressed and benefits produced by interregional transfers.

“Although the metrics and analysis should be common across the interconnections for the reasons stated below, the application of those metrics and analysis to any particular interregional seam would reflect the specific locational and regional characteristics of the two adjoining regions,” EIPC said.

Common analytics would reflect the fact that the Eastern Interconnection is “one large, interconnected machine,” and would avoid having different regions rely on others too much to the detriment of joint reliability.

“EIPC does not support requiring transmission planning regions to use a simplistic ‘easily quantifiable’ minimum Interregional Transfer Capability requirement that cannot demonstrate a true need, and which may not stand up to a prudency review during state CPCN proceedings,” its filing said. “The development of a range of appropriate transfer capabilities that respects regional differences would be more defensible.”

PJM agreed with EIPC (of which it is a member), saying that it is unlikely that a common minimum requirement would be practical given the differences in planning and balancing authority size, topology and extreme weather exposure.

“A ‘range’ would be more appropriate since it could reflect these regional differences,” the RTO said. “As discussed above, PJM supports the EIPC’s proposed analysis to develop a range of transfer capabilities needed to offset the impacts of extreme events.”

PJM also pointed out that one cannot just build lines between different regions without ensuring that their regional grids are capable of supplying them. While it was able to help bail out some of its southern neighbors during winter storms around Christmas last year, the RTO’s aid was limited because of regional transmission constraints.

“PJM’s ability to transfer power between regions was often limited by facilities internal to the region receiving the electricity, and not necessarily by facilities along the seam,” the RTO said. “That is, PJM had additional energy available to be transferred, but could not due to internal congestion in neighboring systems.”

MISO made a similar point, noting that its large footprint at the center of the Eastern Interconnection has required it to work with PJM and other neighbors on formal joint operating agreements (JOAs) that have already improved interregional coordination.

“The commission should be mindful that setting a target number for Interregional Transfer Capability may not necessarily achieve the desired result because adding transmission capacity nominally between two regions would not necessarily account for underlying operational constraints, including those across third party seams and across the interconnection,” MISO said. “In fact, enhancing transfer capacity between two regions may be best served by an upgrade or operating procedures in a third region.”

The JOAs MISO has with PJM and SPP have helped make the most efficient use of existing infrastructure and maximized interregional transfers. The most effective way to increase interregional transfer capability would be to enhance interregional operations and improve interregional planning, MISO said.

American Electric Power (NASDAQ:AEP) was somewhat in between the two sides, saying it would make sense to use a minimum requirement at first to deal with the immediate needs of the system and then switch to improved regional planning.

“With the electric system becoming more weather dependent, increased transfer capacity between regions offers less expensive electricity, the sharing of resource adequacy over wider areas, and improved resilience during extreme events,” AEP said.

Getting the planning process right will take time, so it may be necessary to set some minimum requirements at first, the utility said. The planning process will need to be changed because Order 1000 only required that regions discuss interregional lines, and the different regions use different assumptions, making it hard to agree on specific projects.

CAISO Weighs in from the West

CAISO told FERC that it was worried the commission was adopting a solution before it has clearly articulated a problem.

“Resource sufficiency and extreme event considerations can vary by region, as can reliability, economic, and public policy driven transmission needs,” CAISO said. “The more efficient and cost-effective solutions to address these needs may vary by region and may not necessarily involve increasing interregional transfer capability. Requiring the CAISO region to establish a minimum level of interregional transfer capability is unnecessary and may not provide material benefits to the CAISO system, particularly in times of extreme weather events.”

While it might make sense to increase transfer capabilities in the West given the growth of renewable energy, CAISO does not want FERC to set minimum requirements. The ISO argued its existing planning processes were good enough to handle the issue already, such as its 20-year planning process that calls for another 10 GW of transfer capability by the 2040s.

What About Cost?

One issue that came up in several comments, including from the National Rural Electric Cooperative Association, the Transmission Access Policy Study Group, and joint comments from NRG Energy (NYSE:NRG) and Vistra (NYSE:VST) was the potential costs of adding new lines.

“NRECA member cooperatives have seen significant transmission cost increases in recent years and share a concern that their member-consumers should not be burdened with unjust, unreasonable, or unduly discriminatory transmission cost increases in the years ahead,” it said.

NRG and Vistra said that a line connecting two regions could become one of their largest single contingencies, requiring it to carry extra reserves and thus pushing up prices for consumers. They argued that it would make the most sense to treat interregional lines like pipelines and build them when anchor customers sign up for them (a method that has been used by merchant transmission developers).

“Interregional projects can produce benefits through energy arbitrage,” the two utilities said. “Further, an external or interregional tie has transfer value allocable to the cost of capacity rights in the facility. For this reason, the commission should first try to satisfy any need for Interregional Transfer Capability through a framework that presents options-to-buy to those interested in voluntary purchases of capacity rights on these systems.”

Study: California Needs $50B in Distribution Work for EVs

A study conducted for the California Public Utilities Commission finds that without mitigation, the distribution grids of the state’s three large investor-owned utilities will require up to $50 billion in upgrades by 2035, mainly to accommodate electric vehicle charging.

The Electrification Impacts Study, performed by energy analytics firm Kevala, was commissioned by CPUC as part of its High Distributed Energy Resources Grid Planning rulemaking, which is intended to prepare the state for large-scale transportation and building electrification.

California law requires that all new vehicles sold in-state be zero-emitting by 2035, and the state Air Resources Board is weighing a ban on sales of new natural gas-powered space and water heaters for residential and commercial use. (See Calif. Considers Zero-emission Appliance Rules.)

The study takes these high-electrification scenarios into account. Kevala and CPUC released the findings from its first part May 9 and plan to review the results in a public workshop May 17.

The findings provide preliminary estimates of the impact of widespread transportation electrification on the grids of Pacific Gas and Electric (PG&E), Southern California Edison (SCE) and San Diego Gas & Electric (SDG&E) using a “highly granular load forecast” for more than 12 million homes.

“It is important to highlight that this Part 1 analysis was conducted under unmitigated planning scenarios, which assume only traditional utility distribution infrastructure investments,” the study says. The study also assumed that existing time-of-use rates and behind-the-meter solar tariffs would be in place throughout the study period.

“It did not consider alternatives or future potential mitigation strategies such as alternative time-variant rates or dynamic rates and flexible load management strategies,” the study says.

“Across these unmitigated load scenarios, Kevala estimates up to $50 billion in traditional electricity distribution grid infrastructure investments by 2035,” it says. “This estimate reflects distribution grid needs across the PG&E, SCE and SDG&E service territories under the policy assumptions used in this report.”

Two high transportation electrification scenarios would require the utilities to nearly double their current spending on feeder lines, transformer banks and substations, it says.

“Secondary transformer and service upgrades alone … [comprise] an estimated $15 billion of the $50 billion … and are currently not accounted for” in the investor-owned utilities’ annual assessments of grid needs, it says.

“PG&E’s distribution circuits are projected to reach capacity sooner than SCE and SDG&E,” it says. “SDG&E is expected to have the least number of feeders reaching full capacity by 2035, with 22% compared to SCE’s 36% and PG&E’s 48% of feeders.”

The study forecasts that peak load will increase on the utilities’ distribution systems an average of 56% from 2025 to 2035 under all high-electrification and base-case scenarios.

“This dramatic increase in peak load … is primarily due to transportation electrification impacts, with over 60% of this demand coming from light-duty vehicles,” it says. “The average percent change in peak load from 2025 to 2035 for the high transportation electrification scenarios is more dramatic for PG&E (69%), followed by SDG&E (53%) and SCE (44%).”

Among the study’s recommendations is that the utilities increase their distribution planning horizons to align with those of CAISO and the California Energy Commission, which stretch from 10 to 20 years. That would help them prepare more efficiently for a distribution grid that can incorporate DERs and manage load, it says.

“The substantial difference between the estimated capacity expansion costs, in the several tens of billions of dollars, in this study and the recent filings by the [utilities] suggest there is a disconnect between the data and the current planning process,” it says.

Another recommendation is for the utilities to better incorporate the state’s policy goals in their distribution planning.

A second part of the study will build on the first part’s findings, including by developing scenarios that reflect state policy goals, state agency targets and the Energy Commission’s demand forecast.

USDA Announces $10.7B for Rural Clean Energy Projects

The U.S. Department of Agriculture has announced $10.7 billion in funding from the Inflation Reduction Act to help rural electric cooperatives across the country stand up clean energy, zero-emission and carbon capture projects.

Agriculture Secretary Tom Vilsack described the funding, announced Tuesday, as “the single largest investment in rural electrification since the Rural Electrification Act of 1936.” That law, signed by President Franklin Delano Roosevelt, provided critical loans to farmers and rural communities forming electric cooperatives during the Depression.

The new funding “continues an ongoing effort to ensure that rural America is a full participant in this clean energy economy,” Vilsack said during an advance press briefing on Monday.

The largest chunk of the IRA dollars — $9.7 billion — will go to the Empowering Rural America (New ERA) program, offering “a mix of loans grants and loan modifications to support the purchase or ownership of renewable energy systems, zero-emissions and carbon capture systems,” Vilsack said.

Funding will be “exclusively for rural electric cooperatives,” he said, adding that the IRA allows for “stacking of benefits.” That means projects also can take advantage of production tax credits and investment tax credits in the IRA.

As nonprofit organizations, electric co-ops have previously not been able to take advantage of the ITC but are now able to under the IRA’s direct payment provisions.

The second program, with $1 billion in funding, is the Powering Affordable Clean Energy (PACE) program which will “provide loans — a portion of which can be forgiven — in connection with development of renewable energy projects or energy storage,” Vilsack said. These loans will be open to a broader range of applicants, including corporations, municipalities, co-ops and tribes, he said.

There are three categories of loan forgiveness, ranging from 20% to 60%, depending on where the project is located, Vilsack said. For example, projects in Puerto Rico, Micronesia, the Marshall Islands, Palau and tribal communities will be eligible for 60% forgiveness, according to the USDA announcement.

Micronesia, the Marshall Islands and Palau are island nations that together total more than 2,300 small islands, with  loose affiliations with the U.S.

The goal of the program is “to make clean energy affordable for vulnerable, disadvantaged, tribal and energy communities to heat their homes, run their businesses and power their cars, schools [and] hospitals,” the announcement said.

Figuring in repayment of loans over time, Vilsack said, the $1 billion could be stretched to provide $2.7 billion in loans.

Letters of interest for New ERA are due between July 31 and Aug. 31, while letters of interest for PACE will be accepted from June 30 to Sept. 29, according to the USDA.

Jim Matheson, CEO of the National Rural Electric Cooperative Association (NRECA), was quick to praise the new programs as “an exciting and transformative opportunity for co-ops and their local communities, particularly as we look toward a future that depends on electricity to power more of the economy.”

Matheson called the programs “smartly structured … in a way that will help electric co-ops leverage new tools to reduce costs and keep energy affordable while meeting the future energy needs of their rural communities.”

He also noted that the wide range of eligible projects — including carbon capture, renewable energy, storage, nuclear, and generation and transmission efficiency improvements — will allow individual co-ops to tailor programs to their circumstances.

‘Proven Driver of Economic Growth’

At present more than 900 electric co-ops serve customers in 48 states, with service territories covering 56% of the continental U.S. land mass, including 92% of “persistent poverty counties,” according to the NRECA website.

Co-ops can range from several hundred members to tens of thousands, and because they are largely not regulated, some have been able to adopt aggressive and innovative clean energy programs. The Kit Carson Electric Cooperative in Taos, N.M., has been sourcing 100% of its daytime power from solar since June of 2022 and is exploring the feasibility of using its excess solar to produce green hydrogen to provide night-time power.

Holy Cross Energy, a Colorado co-op, has set a goal of providing 100% renewable power to its members by 2030 and offsetting all emissions to net zero by 2035.

As of 2021, renewable energy constituted about 22% of the power provided by co-ops across the country, while coal and natural gas accounts for 61% and nuclear 15%, according to NRECA.

With financing still a hurdle for many co-ops in rural areas, National Climate Advisor Ali Zaidi called renewable energy “a proven driver of economic growth” in rural communities. Citing an analysis from the nonprofit news site Stateline, Zaidi said that seven of the 10 counties nationwide with the highest increase in gross domestic product between 2019 and 2021 “had revenue that came from wind farm construction.”

The New ERA and PACE programs are “designed to begin the process of allowing the rural electric cooperatives to essentially reach parity, if you will, with the privately owned utility companies that have already begun significant investments” in clean energy, Vilsack said. The funding will “make it a little bit easier for [co-ops] to be able to accelerate plans they may have to transition away from fossil fuel[s].”

PJM PC/TEAC Briefs: May. 9, 2023

PJM Announces Transitional Headroom Allocations

VALLEY FORGE, Pa. — PJM plans to allocate more than 2,000 MW of transmission headroom to generators that requested additional capacity interconnection rights (CIRs) under a transitional process as the RTO shifts to a new methodology for calculating CIRs for effective load carrying capability (ELCC) resources. (See FERC Approves Revisions to PJM’s ELCC Accreditation Model.)

Existing generators or those with signed ISAs may request higher accreditation through the transitional study process, which assigns a portion of available headroom on the grid to those resources. PJM’s Jonathan Kern said about 7,000 MW was eligible to participate in the studies, of which 2,073 MW was awarded, with the remaining 5,000 MW largely denied due to not being available for the upcoming delivery year. Those generators denied can receive access to headroom in future years once they are online.

“It’s just for this particular Base Residual Auction (BRA) that they didn’t achieve the particular milestones to participate,” he said.

The higher accreditation will be added onto resources’ CIRs when running calculations for the 2025/26 BRA and future auctions until the transitional period has ended. Should FERC grant PJM’s request to delay that auction — currently scheduled for next month — Kern said many of the figures calculated could change significantly, including headroom allocations. (See PJM Seeks to Delay Capacity Auctions Through 2028 Delivery Year.)

Most resources received either no increase in their accreditation or the full amount they asked for, with some receiving in between based on locational factors. Kern said there was no queue-based determination in the headroom allocation.

Stakeholders Seek Discussion on CIR Transfers

Denise Foster Cronin, of the East Kentucky Power Cooperative, and Tonja Wicks, of Elevate Renewable Energy, presented a problem statement and issue charge to open a discussion on streamlining the process of transferring CIRs from a deactivating generator to a replacement resource.

“Our motivation to bringing this forward is to add some certainty to something that is currently uncertain,” Cronin said.

The current rules allow CIRs to be used at a resource seeking to interconnect at the same site as the retiring generator or at a different point of interconnection. Transferring CIRs also requires a study of the grid upgrades that may be necessary to support the capacity offered by the new generator, part of the interconnection queue process.

The status quo process assumes studies can be completed relatively quickly, but the queue is backlogged as PJM transitions to a new process meant to complete studies quicker, potentially creating a “timing misalignment.” The problem statement says resources seeking to retire between 2023 and 2026 may expect a delay of four years before they’re able to transfer CIRs to new resources, affecting reliability and cost.

“Inefficiency in the CIR transfer process results in unnecessary additional cost to customers served by these generation capacity resources. Load serving entities may need to seek alternatives and may find inadequate hedges to mitigate market price exposure should CIR transfers not be efficiently executed,” the problem statement reads. “Also, the inefficiency could result in PJM needing to rely on [reliability-must-run] agreements and/or the transmission reinforcements to address reliability issues resulting from generation deactivation that otherwise would not be necessary if CIR transfers could be more efficient. These measures result in cost to load, and the allocation of such costs may extend beyond the zone in which the deactivating generation is located.”

The problem statement also calls for clarifying the resources the CIR transfer rules apply to, noting the status quo language refers to “generation capacity resources.” The document states that more explicit inclusion of energy storage or hybrid resources may be warranted.

The issue charge states that any changes to the current process for transferring CIRs to a replacement resource located at a different interconnection site would be considered out of scope. The sponsors’ presentation said the new standard interconnection process would not be affected.

Stakeholders asked questions on the implementation timeline and expressed concerns regarding possible queue jumping, generators being able to avoid grid upgrade cost allocations and any impact to generators already in the interconnection queue should resources receiving CIR transfers be studied first.

Reliability Requirement Study to Use New Software

PJM plans to use new software to conduct the 2023 Reserve Requirement Study (RRS), the annual process that resets the forecast pool requirement (FPR) and the installed reserve margin (IRM) for the following three delivery years and establishes an initial value for the fourth year out, 2027/28 in this case. The study will also set the winter weekly reserve target for the 2023/24 delivery year. (See “Stakeholders Endorse 2022 Reserve Requirement Study Results,” PJM PC/TEAC Briefs: Oct. 4, 2022.)

Past studies were conducted with the PRISM modeling software, but PJM’s Patricio Rocha Garrido said this year the software developed for the hourly loss-of-load modeling used for the ELCC study will be used in parallel with PRISM. Two separate sets of assumptions will be generated to correspond with the different approaches, and both sets of results will be presented to stakeholders after the study is done, with PJM planning to recommend one of the results for endorsement. PJM plans to ultimately shift to using the hourly loss-of-load modeling software by default in the future.

PJM will also be including data from the 2014 polar vortex based on experience gathered through the December 2022 winter storm. Previously, the polar vortex had been replaced with other data. The capacity benefit of ties will also be averaged over the past several years, rather than using annual data, due to value volatility.

The PC is slated to vote on the RRS approach at its June meeting.

Advocates Push for More Transmission Cost Details

State consumer advocates are seeking more insight into the development of cost estimates for supplemental transmission projects when they are presented to the Transmission Expansion Advisory Committee (TEAC). A presentation by the Consumer Advocates of PJM States (CAPS) said questions to transmission owners about their proposals have not yielded substantive information. (See “CAPS Pushes for More Transmission Upgrade Data,” PJM PC/TEAC Briefs: April 11, 2023.)

For the 22 projects presented at the April TEAC, the presentation said transmission owners were asked how they developed the estimated cost, to provide a breakdown of the project budget and if the relevant state utility commission would have planning oversight. None of the responses regarding project budgets provided a breakdown, instead pointing to processes for receive cost breakdowns after the work is done. None of the responses specifically addressed the question of oversight, the presentation said.

Exelon’s Alex Stern rejected CAPS’ complaint.

“We have enhanced the planning process, and the TOs are providing more transparency in a timely manner than anywhere else in the country,” he said. “We’re also providing the best, most accurate cost estimates that we can based on industry experience when we bring solutions to needs forward followed by cost updates posted on pjm.com quarterly from project inception to project completion.”

The estimates provided to TEAC can significantly change before a project goes to development and is completed based on state and local siting processes, Stern added.

Tom Schmidt of Buckeye Power said the nuances of each state’s oversight provisions can make providing a yes or no answer “very, very difficult,” giving Ohio as an example of a state where oversight depends on specific voltages and project length.

Transmission Expansion Advisory Committee

Data Center Growth in Ohio Contributing to Nearly $600 Million in Transmission Upgrades

American Electric Power presented about $579.5 million in transmission upgrades throughout Ohio to accommodate several new load interconnection requests. AEP’s Nicolas Koehler told the Transmission Expansion Advisory Committee (TEAC) that much of the load stems from a surge in plans to construct data centers, with new announcements over the past few months estimated to consume around 3,000 MW.

The bulk of the expense would be direct connection costs at $498 million, while the remaining $81.6 million are system upgrade costs.

Responding to stakeholders who questioned why the AEP projects weren’t following the same competitive process as the data center alley in Northern Virginia, PJM’s Dave Souder said the Virginia load growth has necessitated upgrades to the regional 500-kV transmission system. PJM has opened a third window to its 2022 Regional Transmission Expansion Plan (RTEP) to address “unprecedented growth” from data centers. (See “Load Forecast for Northern Virginia Data Centers Continues to Climb,” PJM PC/TEAC Briefs: Jan. 10, 2023.)

The largest portion of the Ohio work would involve significantly expanding the grid in the New Albany region and adding about a dozen new substations:

  • The existing Corridor — the Conesville 345-kV line would have two new substations, Curleys and Bermuda, and it would be rerouted to tie into the existing Innovation substation, which would be upgraded to handle both the new 345-kV capability and its current 138-kV lines. The Curleys facility would serve an ultimate load of 968 MW and would come with a $55.2 million price tag, while the Bermuda substation would serve an ultimate demand of 337 MW and would cost around $60.3 million.
  • The Corridor — the Jug Street 138-kV line would have four substations added along its run: Souder, which would serve a projected future load of around 100 MW at a $14.3 million cost estimate; Fiesta (up to 300 MW/$22.3 million); Horizon (200 MW/$11 million); and Badger (290 MW/$18 million).
  • The Green Chapel — the Innovation 138-kV line would be cut and extended around 0.75 miles to connect to the new Tasjan substation, which would serve an ultimate load of 150 MW. The work would cost around $19 million.
  • The Innovation — the Kirk 138-kV line would be cut with two single-circuit lines terminating around 0.35 miles at the new Jorden substation, which would serve a 270-MW load. The project would cost an estimated $12.5 million. A new line would be constructed from the Innovation facility to the Brie substation with around 1.75 miles of double-circuit 138-kV line. New equipment would be installed at the Brie site, addressing potential load drop and overload risks at a $10.8 million expense.
  • The existing Innovation substation in the New Albany area would receive $53.7 million in upgrades to serve 247 MW of additional load. The proposed project includes cutting into the Corridor-Conesville 345-kV circuit and building a new 345-kV ring bus at the site.

Additional substations would be built in the area of Union County and Columbus:

  • The Cyprus substation outside Columbus would be upgraded with 345-kV infrastructure, in addition to the existing 138-kV equipment, and cut into the Beatty-Bixby 345-kV line at a $46.9 expense.
  • The proposal would build the new 138-kV and 345-kV Celtic substation in Union County to serve 461 MW of load at an estimated $60 million. The substation would cut into the Hayden-Hyatt 345-kV line and the Amlin-Hyatt 138-kV line and would also include a new 138-kV line to the existing Kileville line.
  • The Beacon substation would be built for $40 million to supply an ultimate load of 328 MW in the Columbus area. The facility would cut into the Hayden-Roberts 345-kV circuit.
  • The Jerome substation in Plain City would serve an initial load of 106 MW, which could grow as high as 203 MW at a $30 million price tag. The facility would connect to the proposed Celtic substation and the existing Hyatt-Amlin line via new 138-kV lines.

Several Generators Announce Deactivation

PJM’s Phil Yum presented an update on the status of deactivating generators, highlighting seven facilities that have recently requested to go offline.

The new deactivations include the 1,884-MW Homer City coal plant in Pennsylvania, the 1,282-MW Brandon Shores coal plant near Baltimore, and the 167-MW Vienna oil-fired generator in Maryland.

The PJM Board of Managers referenced the Homer City deactivation request in a May 1 letter responding to environmental groups that said the RTO’s analysis of future resource adequacy concerns overstated the issue.

“In performing the analysis discussed in this study, the PJM team made assumptions it believes are conservative, meaning that PJM did not try to overstate resource retirements … In fact, just recently, the largest Pennsylvania coal-fired generating plant, Homer City, announced its retirement. Homer City was not included in our retirement assumptions because the policy drivers underlying its retirement were not known at the time of the study,” the board wrote.

Changes to NJ Offshore Wind Transmission Add $128 Million

Several portions of the transmission planned to connect 6,400 MW of offshore wind to the PJM grid have been changed since the approval of the State Agreement Approach, leading to a $128 million increase in the expected project cost from $1.064 billion to $1.192 billion.

The scope of the work in the Jersey Central Power & Light (JCPL) zone has increased to include the removal of existing equipment to accommodate new lines for $17.47 million, while updated cost projections for previously expected JCPL work has increased by $31.71 million. Work in the Public Service Enterprise Group (PSEG) region has increased by $12.25 million, while a case correction in the PECO zone has reduced cost estimates by $5.6 million.

The expected construction cost for the Larrabee Collector Station, as well as procuring and preparing land adjacent to the site, has increased from $121.1 million to $193.3 million, with the new figures including costs that were explicitly excluded from the original estimate but have been determined to be required for the project.

Kern said additional work was identified after the approval of the project and will require the approval of the PJM Board of Managers. The New Jersey Board of Public Utilities is also aware of the changes.