Search
`
August 15, 2024

Report: Storage Projects Stymied at Distribution System Interconnection

All the Albuquerque Public Schools (APS) system wanted to do was put some solar panels and storage at its largest high school, which has a huge campus and, at times, five-figure electricity bills. And APS had federal and state grants to help pay for the project.

But, according to Tony Sparks, APS’s HVAC and energy projects manager, the 850-kW solar system and accompanying battery storage have now been sitting at the school for close to a year, unable to connect to the distribution system, while school officials have struggled through a Kafkaesque interconnection process.

Beginning in September 2021, a yearlong initial review by APS’s local utility required biweekly meetings with the utility’s interconnection team and was followed by a series of requests for supplemental reviews, Sparks said Wednesday during a webinar on the bottlenecks that storage projects face at the distribution level.

“I didn’t know there were so many supplemental reviews available — technical and grid risk and modification,” he said. “They had a lot of names for them, but each time they would start a new one, they’d say, ‘OK, it’s going to take at least another 30 or 60 business days for this particular one.’ … And I have to say, we felt like we were getting a bit of a runaround.”

A meeting of all stakeholders last month finally resulted in a conditional approval, providing APS made specific upgrades to the distribution system, which, Sparks reported, have been delayed at least 20 weeks because of supply chain and labor issues. Beyond the extra expenses of the interconnection process and upgrades, the school system has lost a “couple hundred thousand dollars” in savings the solar and storage were expected to provide, he said.

“The challenges of this project on the interconnection side [could] greatly discourage development of this kind of project,” Sparks said. “If we didn’t have so much tenacity and enthusiasm, and so many people involved … I don’t think we would have remained in there.”

While overloaded queues for transmission interconnection have become a major focus for the electricity industry, regulators and policy makers, a new report from the Applied Economics Clinic and the Clean Energy Group shows that experiences like Albuquerque’s may also be the norm on local distribution networks across the country. In Massachusetts, for example, the report found more than 1,600 storage or solar and storage projects had either incomplete or withdrawn interconnection applications in 2022, versus fewer than 400 complete or approved.

Interconnection Bottleneck (Applied Economics Clinic) Content.jpg
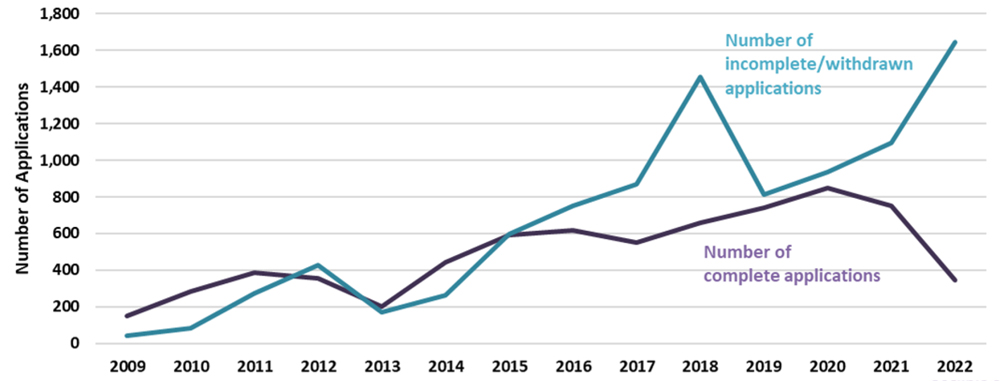
Interconnection bottlenecks in Massachusetts last year resulted in more than 1,600 incomplete or withdrawn interconnection applications for solar and storage projects versus less than 400 complete or approved applications. | Applied Economics Clinic


The webinar, sponsored by the Clean Energy Group, dug into the reasons for such lopsided figures and explored potential solutions. Bottlenecks and other barriers are embedded in the interconnection process itself, said Chirag Lala, a researcher at Applied Economics, who worked on the report.

Key factors are a lack of system planning, the underlying, often mistaken assumptions many utilities make about storage, along with “cost causation,” that is, how the costs of system upgrades are allocated, Lala said.

The need for distribution upgrades is determined based on the “hosting capacity” of specific lines in a system — how much renewable generation or storage they can integrate — on a case-by-case basis as interconnection applications are filed. “It creates a system where nobody is planning ahead of time for distribution-level hosting capacity upgrades,” he said.

“There is not [a state-level] entity … that is able to say, ‘We anticipate this much distributed energy resources will interconnect. We want to prepare for this much solar, this much storage, this much hybrid [solar and storage], and we should make these upgrades in advance,’ Lala said.

In addition, as developers are usually responsible for paying for system upgrades, “it means those who are responsible for managing the distribution grid don’t have a financial incentive to actually invest in hosting capacity more regularly,” he said.

Potential solutions include the use of online maps some utilities — such as Con Edison (NYSE:ED) and Green Mountain Power — are now providing for solar and storage developers to show where lines have adequate capacity for additional projects, and where they are already constrained.

Green Mountain Power’s hosting capacity map allows users to drill down to the substation and line level so developers can be sure a potential site includes the three-phase lines needed for solar and storage projects, said Kirk Shields, the utility’s director of development and risk management.

“It really helped the developers figure out where the best sites are going to be so that downstream, we run into fewer traps about upgrades or just not making [a project] feasible at all,” Shields said. “It’s not a cure-all for every problem, but it certainly has helped smooth out the upfront communication portion of the whole interconnection and build process.”

‘Worst-case’ Studies

Just how much storage is sitting in distribution-level interconnection queues is unknown, but the latest report on transmission queues from the Lawrence Berkeley National Laboratory found close to 700 GW of storage now waiting  to connect to the bulk power grid.

Getting storage online at the distribution level can have multiple benefits for customers and utilities. For school systems like Albuquerque’s, a storage system linked to solar can charge up during off-peak hours, when power is cheap, and discharge during peak times, when power is expensive, which in turn can help trim demand charges.

The city’s Atrisco Heritage Academy High School, where the still-unconnected solar and storage are located, is a 65-acre, multibuilding campus. Summertime electric bills are often in excess of $50,000 per month, more than half of which are demand charges, Sparks said.

For utilities, storage can be used as flexible, peaking power that can defer or even replace the need for system upgrades.

But, Lala said, many utilities are still unfamiliar with how storage operates at the distribution level, which can result in unrealistic studies on interconnection and requests for potentially unnecessary and expensive system upgrades.

“A lot of interconnection processes … don’t define storage very well, or they insist on treating storage in the modeling as operating at the most extreme use cases,” he said. A utility “might say, ‘We want to model storage as if it will charge at peak times when everybody else is coming home and using electricity,’ even if the project applicants say, ‘We never would intend to charge storage around [those] times. We would want to discharge around them.’

“The interconnection processes just generally don’t account for either the technologies or logistical processes that might help in preventing that,” Lala said.

Schuyler Matteson, a senior adviser with the New York State Energy Research and Development Authority, described the tangled process storage developers face in his state, even with utility hosting capacity maps.

“The utilities still like to look at worst case scenarios because technically many of these projects are still uncontrolled; they’re not dispatchable in terms of utility ownership and operation,” Matteson said. “They are still doing two studies ― one worst-case scenario [for] charging, one worst case scenario [for] discharging.”

Further, while many New York utilities have tariffs and demand charges intended to send signals to encourage off-peak charging, Matteson said, “a lot of these interconnection studies are coming back with charging restrictions and discharging restrictions that don’t align with the same utility’s tariffs.”

For example, he said, an interconnection agreement could limit storage developers to charging during peak rather than off-peak hours, resulting in high demand charges. “So, there’s this conflict between real-time operational data that the utility has about usage on their system versus historical rates, and when they don’t align, you end up having this really high cost burden borne by the developers,” he said.

New York also has a “buy-back” demand charge that storage developers must pay for the power they discharge onto the grid during peak times when the power is needed, Matteson said. While the charge is a “historical anomaly” that could soon change ― a new rate proposal is before the New York Public Service Commission ― it can still be “as expensive as the value we’re paying [developers] for the peak power, which makes absolutely no sense at all,” Matteson said.

Flexible Interconnection

Cost causation is still another pitfall, as upgrades are generally paid for by the developer whose project is seen as tripping the need for system improvements or expansion, even if other projects will benefit, Lala said.

“It also creates an incentive then to jockey in the queue, or at least negotiate quite a bit over what those upgrades will be,” he said. “If you are in the queue, it actually matters whether you are first, second, third, fourth or fifth … because if somebody in front of you happens to make upgrades that are useful to your project, you will never be responsible for paying.”

This allocation of costs can also create incentives for utilities “to be extra, extra cautious in terms of the system impact modeling that they do in order to determine hosting capacity upgrades,” Lala said. “If they’re extra cautious and demand more upgrades, that will also raise interconnection costs.”

The Advanced Economics report recommends “reforming cost allocation so that you incorporate more stakeholders than just the project … applying for interconnection,” he said. Developers applying for interconnection in a cluster can help spread costs, providing they can agree on the individual allocations. If not, and “somebody leaves the group partway through the interconnection process, which can and does happen, then you may have to start the interconnection process all over again” Lala said.

Another possibility is that “a single entity can pay for interconnection-related grid upgrades up-front and be reimbursed by other stakeholders post-upgrade,” the report says. For example, a utility could “pay for grid upgrades for smaller-sized projects in the interconnection queue and be reimbursed by customers with larger projects using a one-time pro-rated fee,” he said.

Advanced system planning and pushing for utilities to treat storage “as much as possible based on how [it] will actually operate or function in practice” will also be needed, as well as advanced technologies such “smart inverters” that can help regulate when a storage project charges and discharges.

“Rather than assuming a DER system will export its full nameplate rating, the export capacity (which is equivalent to the nameplate rating or a lower amount when using an acceptable means of control) should be considered and evaluated for its impacts,” the report says.

Smart inverters and distributed energy resource management systems (DERMS) form the core of still another option for improving solar and storage interconnection at the distribution level — “flexible interconnection,” in which utilities have the ability to curtail or discharge power from a specific project.

The approach is widely used in the United Kingdom, where it is a “business as usual” solution for allowing interconnection while avoiding costly distribution system upgrades, said Robert MacDonald, executive vice president for U.K. sales at Smarter Grid Solutions, speaking at a U.S. Department of Energy webinar on Thursday.

The company provides advanced DERMS systems that can optimize distributed energy resource (DER) “hosting capacity by taking advantage of the latent grid capacity that’s inherent within our network,” MacDonald said.

In other words, utilities tend to make conservative estimates of hosting capacity, which can open opportunities for the flexible use of intermittent DERs.

“Rather than take conservative assumptions to the assignation of grid capacity to new DER sites, based on static, worst-case conditions, what we’re trying to do here is, in real-time, reflect that real-time capacity that’s available on the network,” he said. “But, in times where that real-time grid capacity isn’t available to generators with flexible interconnection, then we have the curtailment.”

Static vs flexible interconnection with DERMS (EPRI) Content.jpgStatic interconnection (left) versus flexible interconnection with DERMS, which allows increased integration of distributed energy resources, like storage. | EPRI


U.K utilities use flexible interconnection as an interim method for getting new DERS, such as solar and storage, interconnected, but in some cases, it becomes a longer-term, permanent solution, MacDonald said. Two demonstration projects in upstate New York, both owned by Avangrid, have been using Smarter Grid’s DERMS to flexibly interconnect solar projects for about a year and a half, he said.

Zachary Caruso, lead analyst for programs and projects at Avangrid, said the projects were part of New York’s Reforming the Energy Vision initiative, aimed at spurring innovation and new investment in the state. The 2 MW Robinson solar project, located in Champlain, was sitting in an interconnection queue, waiting for system upgrades, Caruso recalled.

Recognizing the potential to defer the upgrades, “we sort of walked it right out of the queue, and the developer was on board, and we moved forward with it,” he said.

The second project was a 15 MW installation spread over three sites in Spencerport, a suburb of Rochester, where the nearest substation did not have adequate capacity. Again, the projects were flexibly interconnected without costly upgrades, Caruso said.

The projects operate on both “static capacity,” when the power they can put on the grid is limited, and flexible capacity, when they can increase output based on the time of day and time of year, Caruso said. The amount of curtailment necessary at both projects has been minimal, he said.

While both Avangrid projects are solar, flexible interconnection can also be used with standalone storage or hybrid solar and storage, said Karyn Boenker of the Pacific Northwest National Laboratory, who moderated the DOE webinar. Such projects would have to use “a grid-support, utility-interactive inverter with compliant certifications,” such as UL 1741 SA, an advanced inverter safety standard, Boenker said. 

Avangrid has not deployed any other flexible interconnection projects, Caruso said, but the utility sees it as “another tool in our toolbox. … It’s not the be-all and end-all [that] will solve all of the DER interconnection issues that are out there, [it’s] just that we’ve seen on some substations that there is value.”

DC Circuit Partly Vacates FERC Gas Pipeline Approval

FERC will have to take another look at the politically sensitive Mountain Valley Pipeline after the D.C. Circuit Court of Appeals on Friday remanded the commission’s decision to not perform a new environmental assessment of the project (21-1512).

Led by Equitrans Midstream Partners (NYSE:ETRN), the pipeline project, which has major backers including Sen. Joe Manchin (D-W. Va.), has been opposed by environmentalists and others who argue it is unneeded. Opponents have successfully challenged FERC and other agencies’ approvals for the project.

The pipeline, which Equitrans says is 94% complete, runs 303 miles from northwestern West Virginia to southern Virginia to bring shale gas to customers in the Southeast.

FERC granted a certificate to MVP back in 2017, but the project ran into delays as its permits from the Bureau of Land Management, Forest Service, Army Corps of Engineers, and Fish and Wildlife Service were successfully challenged in the courts. The company asked FERC for two extensions to in-service dates, which the commission granted, but those decisions were appealed by Sierra Club and others.

The pipeline now has until October 2026 to finish construction, and this year it regained two other federal permits from Fish and Wildlife, the Forest Service and the Bureau of Land Management. But this year has also seen additional legal setbacks, as the project’s permit from the West Virginia Department of Environmental Protection was vacated in April, which leaves uncertain whether it will be able to obtain a new permit from the Army Corps of Engineers, the court said.

The D.C. Circuit’s decision does not interfere with the pipeline’s construction, but the judges agreed with the appellants’ argument that FERC had failed to conduct a fresh environmental impact statement (EIS) or adequately explain why one was not needed when it extended MVP’s in-service date.

FERC had to prepare an EIS when it initially approved the project, which involved clearing a 125-foot corridor along its route and then digging or blasting a trench to bury the actual pipeline, the soil from which would dislodge into nearby waterways, increasing sedimentation. FERC found those impacts could be controlled by silt fences and other methods.

Both Virginia and West Virginia have fined Equitrans for failing to prevent increased sedimentation along its route.

In allowing the project to move ahead with construction, after it had sorted most of its other required permits, FERC reasoned that wrapping up the build would eliminate the risk of erosion and sedimentation from construction activities.

While the project’s sedimentation impacts differed from what FERC expected due to unpredictable rainfall, the commission determined the deviations were not enough to warrant a new EIS.

Sierra Club and others argued that FERC overestimated MVP’s ability to control erosion and sedimentation, and the court agreed that the regulator failed to explain its rejection of that claim. The violations pursued by the two states show the project’s controls had failures.

FERC failed to explain why the controls would be adequate going forward given the past failures, the court found. It also said the state fines do not excuse FERC from assessing the project’s ongoing environmental impacts.

A consent decree MVP signed, agreed to in a settlement with Virginia, could remediate the issue going forward, but the court said FERC failed to assess that.

Western Grid Challenges Weighed at WCPSC Meeting

NAPA, Calif. — The CEOs of the state’s three largest utilities and CAISO sat down for a panel discussion last week on switching to clean energy and maintaining reliability amid extreme heat, destructive storms and pandemic-caused supply chain problems.

“Today in the West, we face many common challenges in the energy sector,” said California Public Utilities Commissioner John Reynolds, who moderated the discussion at the Western Conference of Public Service Commissioners’ annual meeting at a Napa Valley golf resort.

“We ask ourselves common questions like, ‘How do we integrate the increasing amount of renewables on the grid?’” Reynolds said. “‘How do we plan for and adapt to extreme weather events and changing climate, which affect customer demand, generation resources and infrastructure in ways that we are still continuing to understand? In the face of these challenges and others, how do we ensure that customers are delivered clean, affordable and reliable energy?’”

Steve Powell 2023-05-22 (RTO Insider LLC) FI.jpgSCE CEO Steve Powell | © RTO Insider LLC

The panelists who addressed Reynolds’ questions were CAISO CEO Elliot Mainzer, California Energy Commission Vice Chair Siva Gunda, Pacific Gas and Electric (NYSE:PCG) CEO Patti Poppe, Southern California Edison (NYSE:EIX) CEO Steven Powell and San Diego Gas & Electric (NYSE:SRE) CEO Caroline Winn.

Reynolds asked first about wildfires and extreme weather. To Powell, he posed a question about how SCE had employed “situational awareness” to deal with wildfires.

“Over the last five years, we’ve installed more than 1,600 weather stations on our circuits in high fire threat areas,” Powell responded. “That means most circuits have two to three weather stations on them. Those weather stations give us enough granularity, when combined with other forecasts and detailed models, to get a lot more targeted about where we have to deploy our public safety power shutoffs.”

Power safety power shutoffs (PSPS) are the intentional blackouts Western utilities use to prevent their equipment from sparking wildfires during dry, windy conditions, usually in late summer and fall. When SCE started using PSPS in 2018, it would turn off entire substations or service areas.

Patti Poppe 2023-05-22 (RTO Insider LLC) FI.jpgPG&E CEO Patti Poppe | © RTO Insider LLC

“We’re now able to break that down and get specific parts of circuits to take off, and it’s allowed us to decrease the amount of customers [affected by] a PSPS outage by 80 to 90% in most cases,” Powell said. “So that’s been a huge part of that situational awareness.”

Reynolds asked Poppe about this winter’s series of “atmospheric river” storms that drenched California between December and March.

“Can you tell us about the operational challenges that these kinds of extraordinary events present for utilities?” he asked.

The season started with a 6.2-magnitude earthquake off the coast of Northern California that knocked out power to thousands of customers, followed by one storm after another that wreaked havoc on PG&E’s infrastructure, Poppe noted. Starting with the quake, “we were in emergency response mode until mid-April, so we definitely had a lot of opportunities to learn,” she said.

“We would have an atmospheric river with 400,000 customers out and back on within 24 hours; 300,000 customers out and back on within 24 hours. It just went on and on and on,” Poppe said.

Weather forecasts and advance preparation played a big part, she said.

“We could pre-stage things like backup generation and substations before the storm hit,” she said. “So, we could respond and have the crews in the right places at the right time and have our resources and our equipment in the right places at the right time, and that is extraordinarily effective.”

Mutual assistance from other Western utilities helped PG&E cope, she said.

“We could not have gotten through all of these events without the support from all of the states and all of the utilities in the West who, when we called, you answered,” she told the audience.

Supply Chain Issues

Reynolds asked Winn about how SDG&E had dealt with supply chain issues at a time when utilities are “contracting and building swiftly to meet our midterm reliability needs.”

The state has struggled with blackouts and near misses the past three summers, and utilities have been connecting thousands of megawatts of new clean energy and storage resources to head off further problems.

Caroline Winn 2023-05-22 (RTO Insider LLC) FI.jpgSDG&E CEO Caroline Winn | © RTO Insider LLC

“When you think about the work that we’re doing on climate change adaptation … [and] extreme weather; when you think about the work that we’re doing to meet California’s aggressive clean energy goals; and when you think about the pandemic, everything that we need to do needs to be different,” Winn said. “It needs to be different than we have historically done.”

For years, SDG&E bought materials on a “just-in-time” basis, ordering from suppliers a few weeks before materials were needed.

The pandemic changed that, requiring longer-term planning, she said. Complications from adding large amounts of rooftop solar power and demand from electric vehicle charging are also “changing the game.”

SDG&E has seen demand drop by 2% a year since 2014 because many property owners are adding rooftop solar panels,” Winn said. But the utility is now expecting large increases from EV adoption, which jumped 25% in one year in San Diego, and from homeowners who are swapping out gas appliances for electric heat pumps, water heaters and stovetops.

The utility is also tripling the amount of storage on its system and needs dozens of larger transformers to handle the 70 powerful DC fast chargers it plans to install.

“All of that needs supply chain, and we can’t do things the way that we used to,” Winn said. “Now we have to meet with all of our major customers and understand: ‘What is your electrification plan? What is your load-growth plan?’ And be able to plan for that in a much more detailed way. It’s just required.

“We’re ordering things early, whether we need it or not,” she said.

Load Forecasting

Gunda said the CEC’s load forecast is changing because of vehicle and building electrification.

Siva Gunda 2023-05-22 (RTO Insider LLC) FI.jpgCEC Vice Chair Siva Gunda | © RTO Insider LLC

California recently hit its goal, two years ahead of schedule, of having 1.5 million EVs on the road. The state is aiming to entice property owners to install 6 million heat pumps in the coming years.

“All of these things bring uncertainty” in load forecasting, Gunda said.

The CEC has begun using demand forecasts with base case and high-electrification scenarios. In the high-electrification scenario, it plans for 6 million EVs by 2030, even though that may not happen.

It’s also factoring in extreme weather, he said.

“In 2022, for most of the year, we were tracking average weather in California,” he said. But during a severe heat wave that spanned 10 days in September, “we deviated 15% from what our planning assumption was. So, we were 7,000 MW off what we were expecting in September. That’s what we’re trying to bring into our forecast.”

Western Markets

The September 2022 heat wave drove CAISO to the brink of ordering rolling blackouts for the second time in three years.

How can Western states collaborate to serve customers in extreme weather? Reynolds asked.

Elliot Mainzer 2023-05-22 (RTO Insider LLC) FI.jpgCAISO CEO Elliot Mainzer | © RTO Insider LLC

Mainzer said CAISO’s interstate Western Energy Imbalance Market (WEIM) has been important for regional reliability and could be even more effective if it expands from a real-time market to a day-ahead platform, as planned. The ISO is preparing tariff language to send to FERC for a WEIM extended day-ahead market (EDAM).

“Last summer, when we were right in the middle of that incredible heat wave, there was a lot of focus on California’s [strained grid] … but there was also all-time record demand in the Western United States,” Mainzer said. “We had 167,500 MW of demand [in the Western Interconnection] on Sept. 6, 2022, so California was in distress, but other parts of the West were also struggling.”

“It was kind of amazing, from the control center, to watch the Energy Imbalance Market as it was cycling energy around on a five-minute basis across the West, helping not only California but other parts of the West that were struggling with reliability to keep the lights on,” he said.

If CAISO has a day-ahead market, “where we could look out across the broader footprint in the incredibly diverse Western United States and have the visibility into the overall sufficiency of that footprint, we would be able to move electricity to where it is most needed to be able to pre-emptively mitigate energy emergencies,” Mainzer said.

Energy emergencies in California the last three summers made wholesale electricity prices soar at key Western trading hubs.

A West-wide day-ahead market would also bring reliability benefits during times of “volatility and uncertainty that we see on the grid. It’s going to be the reliability component of regional coordination that I think more and more is going to see an even greater value,” Mainzer said.

PJM MRC/MC Preview: May 31, 2023

Below is a summary of the agenda items scheduled to be brought to a vote at the PJM Markets and Reliability Committee and Members Committee meetings Wednesday. Each item is listed by agenda number, description and projected time of discussion, followed by a summary of the issue and links to prior coverage in RTO Insider.

RTO Insider will be covering the discussions and votes. See next week’s newsletter for a full report.

Markets and Reliability Committee

Consent Agenda (9:05-9:10)

The MRC will be asked to endorse:

D. proposed revisions to Manual 3: Transmission Operations resulting from its periodic review. The proposed language updates references in the document and aims to add clarity.

E. proposed revisions to Manual 11: Energy and Ancillary Services Market Operations related to real-time values through its periodic review. The changes are largely typographical.

F. proposed conforming revisions to Manual 11 to implement the transmission constraint penalty factor proposal approved by the committee during its Nov. 16, 2022, meeting. (See FERC Approves PJM Proposal to Reduce Congestion Penalty During Grid Upgrades.)

Issue Tracking: Operating Reserve Demand Curve (ORDC) & Transmission Constraint Penalty Factors

G. proposed conforming revisions to Manual 11, Manual 27: Open Access Transmission Tariff Accounting and Manual 28: Operating Agreement Accounting Market Operations related to the hybrid resources phase 1 package approved by the MC on Feb. 23. (See “MIC Endorses Proposal on Hybrid Resources,” PJM MIC Briefs: Nov. 2, 2022.)

Issue Tracking: Solar-Battery Hybrid Resources

H. proposed revisions to Manual 15: Cost Development Guidelines related to the heat input guidelines and the Independent Market Monitor’s opportunity cost calculator. The changes to the heat input guidelines include documenting the current methods for units to develop their heat input curves, while the opportunity cost calculator changes include a description of a two-hour look-ahead window for the commitment and de-commitment of generators in the calculator.

Issue Tracking: Opportunity Cost Calculator 2023 and Combined Cycles and Specialized Boilers Heat Input Guidelines

I. proposed revisions to Manual 36: System Restoration as part of its periodic review.

Endorsements (9:10-9:50)

1. Synchronized Reserve Requirement for Reliability (9:10-9:50)

A. PJM’s Donnie Bielak and Phil D’Antonio will present proposed revisions to Manual 11 section 4.3 and Manual 13: Emergency Operations section 2.2 to correspond with the increase to the synchronized reserve requirement announced at the May 11 Operating Committee meeting. The revisions seek to clarify when PJM can increase the reserve requirements. (See “PJM Doubles Synchronized Reserve Requirement,” PJM OC Briefs: May 11, 2023.)

B. Monitoring Analytics President Joe Bowring will give a presentation on the Monitor’s perspective on the increase.

Members Committee

Consent Agenda (1:05-1:10)

The MC will be asked to endorse:

B. proposed tariff and Operating Agreement revisions addressing renewable dispatch. The proposal was endorsed by the MRC at its April 26 meeting and is intended to provide dispatchers with more data to aid in anticipating the output of renewables. (See “Renewable Dispatch,” PJM MRC Briefs: April 26, 2023.)

Issue Tracking: Renewable Dispatch

NYISO MMU Calls for Improved Shortage Pricing, More Capacity Zones

NYISO needs to improve shortage pricing and create smaller capacity zones, the ISO’s market monitoring unit (MMU) said in its 2022 State of the Market report.

MMU Potomac Economics, which presented its findings at Thursday’s Installed Capacity/Market Issues Working Group (ICAP/MIWG) meeting, reported that the ISO remained competitive in 2022 but said changes are needed to ensure market efficiency as renewable penetration increases.

Average all-in price (Potomac Economics) Content.jpgAverage all-in price by New York region | Potomac Economics

The report includes five high-priority recommendations, three of which — modeling local reserve requirements in New York City load pockets, dynamically adjusting operating reserve requirements, and improving capacity modeling and accreditation (Recommendations #2017-1, 2015-16 and 2021-4) — are already being pursued.

Also on the high-priority list are a recommendation from 2017 to modify operating reserve demand curves to improve shortage pricing (#2017-2) and one new recommendation: to create more “granular” locations in the capacity market (#2022-4).

The MMU found that NYISO’s shortage pricing has fallen well below that of neighbors PJM and ISO-NE. “When there is an imbalance between the market incentives provided in two adjacent regions, it can lead market participants to schedule interchange from the area with weaker incentives to the area with stronger incentives even when the area with weaker incentives is in a less reliable state,” the MMU said.

Four Capacity Zones Not Enough

The MMU said the ISO’s current four capacity zones (New York City, Long Island, Lower Hudson Valley and Rest-of-State) are too large to provide efficient locational price signals to incent new flexible generation and encourage the retirement of less valuable resources.

The state’s four zones do not account for transmission limits within the zones, meaning resources at some locations are over- or under-compensated relative to their reliability value, the MMU said.

It recommended the ISO create and “dynamically update” an increased number of capacity zones reflecting the known transmission constraints, saying the change also would address “concerns that the current deliverability framework is an inefficient barrier to investment in new resources.”

It said the ISO should not use its existing capacity zone creation process, which it called “flawed and ineffective.”

Potomac said the ISO’s method for determining local capacity requirements (LCRs) results in inefficient prices across zones and excessive price volatility.

Instead, it said the ISO should consider basing locational pricing on marginal reliability values instead of the current zonal demand curves. “This could result in sizeable reliability and economic benefits over the long term and simplify the administration of the capacity market,” it said.

In the 2023/24 capability year, the MMU said, large resources and “Special Case” demand response resources in New York City will receive as much as $52 million in excess capacity revenue.

Some fossil fuel and nuclear generators also were overpaid because the ISO included in their installed capacity 1,200 MW that was “functionally unavailable” on the hottest days last summer, Potomac said. “This includes resources with emergency capacity that is virtually never committed in practice, resources with ambient water and air humidity dependencies that are not captured in the [dependable net maximum capability] testing process, and cogeneration units that face limitations associated with their steam host demand.”

The MMU reiterated a recommendation from its 2021 report that the ISO improve its resource adequacy model (#2021-4) and added a new proposal: that it compensate capacity suppliers based on their contribution to transmission security when LCRs are set by transmission security needs (#2022-1).

Deliverability Testing

Potomac also highlighted what it called a misalignment of the ISO’s deliverability framework, which it said “unreasonably inhibits new investment.”

It noted that the recently completed Class Year 2021 study initially allocated $1.5 billion in system deliverability upgrade costs to 4 GW of new projects seeking to sell capacity — costs that equaled between 50% and 293% of the net cost of new entry of a new peaking plant. “Unsurprisingly, three-quarters of the affected projects refused to pay these costs and either withdrew from the Class Year or accepted a reduced quantity of [capacity resource interconnection service] rights,” Potomac said.

Current ISO rules use a deterministic test “that often does not represent a realistic or likely dispatch of the system during conditions when reliability is threatened,” Potomac said. “This problem is exacerbated by performing the test in relatively large capacity zones with many potential intrazonal constraints.”

In the short term, the MMU said, the ISO should identify “a comprehensive set of granular locations” that would effectively shrink the size of the capacity zone in which new interconnecting resources would have to be deliverable. The change also would allow reduced clearing prices in export-constrained areas, it said.

Seasonal Capacity Market

The MMU also recommended the ISO move to a seasonal capacity market, with requirements and demand curves that consider the reliability needs of each season separately (#2022-2). Although the capacity market is divided into six-month summer and winter capability periods, the installed reserve margin and LCRs are determined annually, so ICAP requirements are the same in all months. “As a result, seasonal prices are determined by the amount of ICAP available in each season, which bears little relation to resource adequacy risk,” Potomac said.

Transmission Planning

The MMU also offered a new recommendation on transmission planning, saying current rules allow inefficient projects to crowd out competing market-based investments — including transmission and nontransmission resources — that could achieve the same policy goals at lower cost.

Potomac acknowledged the ISO’s recent addition of capacity expansion modeling tools. But it said additional changes are needed to respond to the increased uncertainty from the growth of policy-sponsored resources.

It recommended the ISO update its planning study methodology to reflect the market incentives of renewable and storage resources; consider changes to the resource mix resulting from the inclusion of economic and public policy projects; and estimate transmission project benefits based on their market value to the ISO (#2022-3).

The MMU’s report was discussed with stakeholders for the first time at the ICAP/MIWG meeting, where the focus was on energy and ancillary services. Potomac will present the report to the Management Committee meeting and discuss capacity market issues at the next ICAP/MIWG meeting, June 6.

Other Recommendations

Potomac’s Pallas LeeVanSchaick, who presented the findings at the May 25 meeting, said the efficiency of the energy and ancillary services markets will become increasingly important as NYISO increasingly shifts from fuel-secure generation to intermittent renewables.

The report cited inefficiencies for reserve providers, which are not being compensated for their congestion relief; duct-firing combed cycle units, which are not being properly dispatched; and phase angle regulators, which are inappropriately being used to satisfy bilateral contract flows.

In addition to the high priority recommendations, LeeVanSchaick also highlighted five other proposals during Thursday’s meeting.

  • 2015-9: Eliminate transaction fees for coordinated transaction scheduling at the PJM-NYISO border.
  • 2016-1: Consider rules for efficient pricing and settlement when operating reserve providers provide congestion relief.
  • 2020-1: Consider enhancements to the scheduling of duct-firing capacity in the real-time market that more appropriately reflect its operational characteristics.
  • 2021-2: Model full locational reserve requirements for Long Island.
  • 2022-3: Improve transmission planning assumptions and metrics to better identify and fund economically efficient transmission projects.

Market Highlights

Potomac reported that average natural gas prices roughly doubled from last year in eastern New York and rose 70% in the western part of the state due to increased LNG exports and cold weather.

The high gas prices drove energy prices, with average energy prices in Western New York rising to 109% over 2021 and Eastern New York rising as much as 126%. Gas prices, cold weather and transmission congestion pushed all-in energy prices to the highest levels observed in more than a decade, ranging from $58/MWh in the North Zone to nearly $127/MWh in Long Island.

More severe transmission congestion in the Central-East interface because of lengthy outages during construction of the AC Public Policy Transmission Projects contributed to the East-West price separation.

Capacity costs fell, primarily because of changes in the installed reserve margin for the system and LCR requirements for New York zones.

Winter Storm Elliott

Another highlight from Potomac’s annual report was the analysis of Winter Storm Elliott’s impact on the New York grid, which showed NYISO’s market operations relied heavily on the scheduling of internal peaking units to meet high demands and that large quantities of generating capacity was unavailable because of fuel limits or outages.

Resource supply availability (Potomac Economics) Content.jpgResource supply availability and utilization during Winter Storm Elliott | Potomac Economics

Winter Storm Elliott hit the Northeast from Dec. 23 to Dec. 27, 2022, and blizzard conditions through the 24th caused New York energy prices to spike to more than $4,000/MWh.

LeeVanSchaick said the storm “was the first significant test for some market processes that have come into place over the past 10 years that deal with shortage conditions.”

“This was the first time we’ve seen long-duration reserve shortages since PJM and ISO-NE put [Pay-for-Performance] rules in place,” he added. PFP rules incentivize generators for being available during tight supply conditions.

On Dec. 23 and 24, NYISO experienced eight hours of reserve shortages, locational-based marginal prices of more than $2,000/MWh, roughly 4 GW of import curtailment and around 2.3 GW of unavailable fossil fuel capacity because of outages or derates.

Because the amount of forced outages and derated capacity was higher than anticipated, Potomac said NYISO needs to better monitor generator performance during extreme weather, given that current resource adequacy models may be underforecasting load during these cold conditions and inefficiently dispatching generators to provide reliability.

The report also noted that about 80% of unoffered capacity during the blizzard was from energy storage and other duration-limited resources. The MMU said NYISO needs to investigate ways to make sure that during cold conditions, these resources can recharge after being called upon and be available for extended periods of time.

Potomac said the ISO’s real-time commitment scheduling was being undermined, citing the number of import curtailments and unforeseen reductions in supply availability, because of either high gas prices or inefficient market signals.

The MMU noted that several fast-start units were either being shut down or not started up when they might have otherwise, which meant 470 MW of these units was unavailable and an additional 1,350 MW of 30-minute fast-start capacity was sitting offline. This resulted in imports from neighbors like PJM to be curtailed because of unnecessarily high prices in New York.

Based on these findings, Potomac made several recommendations to improve NYISO’s capabilities during future winter storms.

The MMU recommended setting prices consistent with the reliability risks during a reserve shortage event, enhancing capacity accreditation models for nonfirm fuel generators or duration-limited resources, and scheduling additional reserves before blizzard conditions to decrease the NYISO’s reliance on imports.

Overheard at USEA’s 2023 Public Policy Forum

WASHINGTON – The United States Energy Association saw a change of leadership and heard from speakers on the transition to clean energy at its Annual Membership Meeting and Public Policy Forum last week.

Acting USEA Executive Director Sheila Hollis, of Duane Morris, has run the organization since longtime Executive Director Barry Worthington died in 2020. She announced her term was coming to an end and that she would be replaced by former U.S. Deputy Energy Secretary Mark Menezes.

NARUC’s White Speaks on the Role of the States

“We have an international programs department, and Sheila has heard me say this many, many times,” said Greg White, executive director of the National Association of Regulatory Utility Commissioners. “I consider us to be a partner with USEA. USEA does training for the utilities around the world. And we go into those exact same countries, and we train the regulators.”

NARUC has worked in more than 50 countries in its history and is currently helping 30 with their regulatory systems, he said. White’s first overseas trip was to the country of Georgia, where he helped fix its creaky, post-Soviet grid.

“Everybody in the country was carrying a flashlight with them because in the Soviet-era buildings, the elevators usually didn’t work,” White said. “And so, people had to walk up many flights of stairs in the dark to get to their apartments.”

Now the Georgian grid is reliable 24/7, and the days of always needing a flashlight are over, he said. That is what drives regulators here and abroad — bringing light to the world, he said. The challenge now is to make the grid’s transition happen without major issues.

“We’re trying to get cleaner energy that is sustainable, reliable, resilient and affordable,” White said. “And we need to balance all those interests.”

Most of the progress that has been made on clean energy in recent years is because of state and local policies, but now much of the conversation in D.C. on permitting reform would strip those states of at least some of their authority to site transmission lines.

“We’ve got some proposals in Congress right now that, quite frankly, would eviscerate the role of the states and permitting new infrastructure, especially as it pertains to the much needed electric transmission infrastructure,” White said. “We believe that that would be a mistake because the states have considerably more success at siting infrastructure than the federal government.”

NARUC’s engagement with FERC has been more fruitful, with White highlighting the Joint Federal-State Task Force on Electric Transmission as helping to reach common policies needed to make the energy transition work.

The ‘Materials Transition’

Another aspect of the clean energy transition that was not addressed much by major legislation last Congress is materials, said Michelle Foss, fellow at Rice University’s Baker Institute for Public Policy.

“I’m going to take a modicum of credit for the phrase ‘materials transition,’” Foss said. “The idea that the energy transition is a materials transition is because I pushed to get minerals on the agenda of an international meeting last year. And we were successful in that, and now I’m finding this phrasing is rolling around.”

The conference was in Tokyo, and the Japanese government has been pushing the issue to the forefront. Foss said the G7 nations are now actively pursuing the issue.

“My own view on this is that you put materials first,” Foss said. “But we didn’t do that. We rolled out an enormous spending program, sending people off in all manner of directions trying to do things that they can’t do, because we don’t have the material supply chains to support them. And that … is energy policy in the United States.”

Foss is an alumna of the Colorado School of Mines. When she was there in the 1980s, the domestic mining industry was dying, and now it has essentially given up all of its capacity, she said. Labor and compliance with environmental laws, which brought benefits, have made the business generally too expensive here, so it moved overseas.

“China constitutes 44%, in our math, of total tonnage of nonfuel minerals in the world today, everything from metals to non-metals, to construction materials — they are it,” she said. “This is not their fault; it’s ours. We gave up our capacity, and China took a market share.”

The U.S. is going to need secure supply chains of many minerals as it transitions to a clean economy, replacing equipment and infrastructure as they wear out, said Foss.

While much of the focus in the energy industry involves a shift away from carbon, Foss said that the element was going to be important forever because it is also used to make superior and cheaper materials that can replace metals.

“If I can displace metals with that, then I’m simply doing what humans have been doing for decades now, which is displacing metals with plastic, but a better form of it; a more advanced form of it,” Foss said.

MISO, SPP Staffs Take Crack at Rate Pancaking

SPP staff told stakeholders Friday they will work with MISO staff to draft a white paper on rate pancaking and unreserved use, two issues that bedevil utilities along the RTOs’ seam.

Clint Savoy, SPP’s manager of interregional strategy and engagement, told participants during the RTOs’ spring update on common seams initiatives that the focus will be rate pancaking. He said while the two issues are separate and distinct, rate pancaking “is more of an issue that occurs.”

The RTOs’ staff will work with stakeholders and solicit their input in developing solutions, Savoy said. SPP will also use Seams Advisory Group as a sounding board in determining the paper’s final draft. Later work will involve analyzing the proposals to determine their impact.

MISO’s Marc Keyser, director of seams coordination, membership services and customer coordination, said his staff will be slow to join the effort, given their work with the grid operator’s long-term transmission planning.

“We may have difficulty doing some of the analysis we want to do with the white paper, but we’re looking forward to working with SPP,” he said.

A working group composed of state regulators from the grid operators’ footprints was the most recent stakeholder group to look at rate pancaking, which occurs when power is scheduled across more than one transmission provider’s borders and each provider assesses full or partial charges for use of the facilities. That leads to duplicate transmission fees between the various providers.

Arkansas Electric Cooperative Corp. (AECC) said during a presentation to the group that it has incurred about $100 million in incremental costs over the past 10 years because of pancaked rates. AECC is connected to four transmission systems within the two RTOs.

Unreserved use charges can be assessed when an RTO transmission customer does not reserve adequate service to cover its load obligation. These charges are higher than the cost of reserving transmission and can have a ratcheting effect that transmission customers see as punitive.

The RTOs are currently involved in a dozen seams initiative between themselves and with stakeholders, both at the state and federal level. Their staffs will hold another update on seams initiatives in November.

FERC Sides with SPP Over Interconnection Study Complaint

FERC last week denied a solar farm developer’s tariff waiver request and a complaint against SPP over the RTO’s interconnection studies for the planned facility (EL22-89).

The commission issued an order May 23 finding that Cage Ranch, a 900 MW project in West Texas, had not met its burden to show that SPP violated its tariff or conducted its studies in an unjust and unreasonable manner. It said the solar facility did not demonstrate the study models underlying the cluster study were defective.

Cage Ranch said in an amended complaint that the study in question should not have been used to determine interconnection costs for the solar farm and other customers in the study group because SPP failed to resolve alleged nonconvergence issues. But FERC pointed out that the grid operator assigned Cage Ranch network upgrade costs using a modeling approach it applies to all interconnection customers.

The Cage Ranch developers last year challenged SPP’s use of what it called a “defective” study model that assigned interconnection costs and calculated its security obligations within its study cluster. It asked FERC to direct the grid operator to resolve the study model’s defects, allow interconnection customers to post security after the defects are resolved, and require SPP to restore the customers’ queue positions in the study cluster.

Cage Ranch also requested a tariff waiver to extend a decision point deadline until FERC resolved the complaint and SPP issued an updated and corrected study. The commission denied the request, finding Cage Ranch did not satisfy the criteria for such requests (the applicant acts in good faith, the waiver is of limited scope, it addresses a concrete problem, and it does not have undesirable consequences).

OPPD Show-cause Order Ended

The commission also accepted SPP’s tariff changes revising Omaha Public Power District’s (OPPD) protocols, effective January 2024, and terminated a show-cause proceeding under Section 206 of the Federal Power Act (ER23-72).

FERC issued the show-cause order last July after determining that OPPD’s protocols under the tariff appeared to be unjust and unreasonable. The commission directed SPP to either show cause as to why the protocols remained just and reasonable or explain the changes that could be made to remedy the identified problems should FERC find the protocols unjust and unreasonable.

In an order issued May 22, the commission found SPP’s proposed revisions to be just and reasonable and consistent with precedent established in 2015 by MISO protocols orders. FERC said the revisions resolved unclear wording and three technical errors identified by two protests late last year.

The commission said the revisions remedy the show-cause order’s identified concerns and terminated the proceeding.

As amended, the revisions require OPPD to respond to information or document requests within seven business days, giving parties additional time to review and raise informal challenges.

Eversource Begins Its Exit from OSW Development

Eversource (NYSE:ES) last week began its anticipated departure from the offshore wind sector, announcing it would sell its interest in an uncontracted New England lease area to its development partner, Ørsted.

Eversource also said it would soon announce sale of its share of three other offshore projects that are farther along in the development process: South Fork Wind, Revolution Wind and Sunrise Wind. Ørsted holds a 50% stake in those projects as well.

The two companies — New England’s largest utility and the world’s largest offshore wind developer — teamed up six years ago to pursue a share of the clean energy production planned off the shores of New York and New England.

Their 132 MW South Fork Wind project south of Rhode Island is expected to start producing electricity this year. It will earn the distinction of being the first utility-scale offshore wind farm in the U.S. unless nearby Vineyard Wind 1 crosses the finish line first. Both started construction last year, but Vineyard is much larger than South Fork, at 800 MW.

Details

Eversource indicated last year that it was looking for an exit from the offshore wind business. CEO Joe Nolan told financial analysts this month that negotiations were nearing completion.

The company will fully exit the development space, but it expects to have a role in transmission of the offshore power generated by Ørsted, he said.

Eversource said Thursday it will sell its 50% stake to Ørsted for $625 million in cash, some of which Eversource will use to provide tax equity for the South Fork Wind project through a new tax equity ownership interest. Eversource will recover that investment through tax credits received around the time of the wind farm’s commercial operations date.

As part of the deal, Ørsted will gain full ownership of partnerships with Quonset Point, the Port of Providence and the Port of Davisville, all in Rhode Island, and the New London State Pier in Connecticut; ownership of the operations and maintenance hub in East Setauket, N.Y.; and the charter agreement for the offshore wind service operations vessel being built in Louisiana.

Eversource said Thursday it expects to announce sale of its share of Revolution, South Fork and Sunrise by the end of June.

Based on the prices being negotiated and on the value of its aggregate investment to date in offshore wind development, Eversource expects the transactions to result in a second-quarter after-tax impairment charge of $220 million to $280 million.

It said it would use net proceeds from the transactions for debt reduction.

The sale to Ørsted is subject to approval by The Committee on Foreign Investment in the United States.

The transaction announced Thursday entails Lease Area OCS-A 0500, known as Bay State Wind. The 187,000-acre tract of federal waters south of the Massachusetts islands of Martha’s Vineyard has a potential capacity of up to 4 GW of wind power.

Ørsted and Eversource as Bay State Wind LLC have submitted proposals for projects they called Sunrise Wind 2 and Revolution Wind 2 in the most recent offshore wind solicitations by New York and Rhode Island, respectively.

No contracts have been awarded yet in either solicitation.

Ørsted said it would continue as the sole bidder on both.

NJ $1 Billion OSW Port and Marshaling Hub 60% Finished

LOWER ALLOWAYS CREEK, N.J. — On a wind-swept tract in the shadow of three nuclear plants, New Jersey’s massive $1 billion play to jump start a new energy industry based on harnessing wind power is proceeding apace on the banks of the Delaware River.

Construction of the New Jersey Wind Port, a 200-acre marshaling, manufacturing and logistics hub for the offshore wind sector, is on schedule and on track for completion of the first phase in April. Phase one will be capable of simultaneously handling multiple turbine towers more than 400 feet long, state officials say.

That phase, with a $550 million price tag funded with state money, will be followed by a second phase, expected to begin construction in early- to mid-2024, with an additional expense of about $550 million. The target completion date is 2027 or 2028.

State officials say they are building the nation’s first custom-designed port able to handle the growing offshore wind (OSW) sector and capable of handling several projects at once, including those inside New Jersey and along the East Coast. And on a recent afternoon, as a state official led a tour of the site for RTO Insider, there were few signs that the state’s massive commitment to wind energy has been sapped by the controversy over a spate of whale deaths in the region or recent opposition to turbines that will stretch more than 900 feet into the air.

“We’re at 60% completion; we’re on or ahead of schedule,” said Jonathan Kennedy, vice president, infrastructure, of the New Jersey Economic Development Authority (EDA), which is funding the port and has overseen its development since Gov. Phil Murphy first announced the plan in June 2020.

“That’s a pretty rapid mobilization and progression from planning to construction,” Kennedy said. “If you came back here April 1, ‘24, you should be looking at a complete port, fully operational, that’s licensed by the Coast Guard.

“The driver here is that we have a non-negotiable need to get this port complete on time,” he said.

Emerging Need

That driver is the 1,100-MW Ocean Wind 1, the state’s first offshore wind project, which was approved in 2019 and is scheduled to begin construction next year. The state Board of Public Utilities (BPU) has since approved two more projects, the 1,148-MW Ocean Wind II and 1,510-MW Atlantic Shores, in the state’s second solicitation in 2021. (See NJ Awards Two Offshore Wind Projects.)

A third solicitation launched by the BPU on March 6 could approve projects totaling 4 GW, and perhaps more, as the state reaches for a goal of 11 GW of OSW capacity by 2040. (See NJ Opens Third OSW Solicitation Seeking 4 GW+.)

The EDA has steadily crafted a sweeping plan to create a support infrastructure around the offshore projects that includes a flagship research hub, small business nurturing programs to provide a groundswell of qualified contractors, and a Wind Institute for Innovation and Training.

At its May meeting, for example, the board approved five grants totaling $3.7 million for programs to train OSW workers and $500,000 for a marketing and communications budget for the wind port, including a new website. The board also backed $6 million in expenditures for construction and test piling done in the land parcel for the second phase of the port.

“New Jersey has a choice of whether we want to lead, follow or be left behind by the clean energy revolution, particularly offshore wind,” Tim Sullivan, EDA’s CEO, told an assembly budget committee hearing on May 17. “And that is an opportunity that if we don’t capitalize on it, I promise you, governors and legislators and other states will. And it’ll be gone, and we will have missed this generational opportunity.”

Hard Hats and Piling

The half-built port, on a recent afternoon, was a hive of activity. A cluster of a dozen half-sunken gray piles soared 30 feet into the air in one section, awaiting attention from a massive yellow crane to pound them down to ground level, ready to support the port marshaling platform. Nearer the water’s edge, workers in black and blue hard hats and bright yellow vests readied rows of steel rebar that would eventually be swathed in concrete to become the berth at the water’s edge.

A few hundred yards away, in the undeveloped section that will become phase two, workers drained water out of sand dredged from the river through a giant sucking pipe.

New Jersey Wind Port Construction 2 (RTO Insider LLC) Alt FI.jpgWorkers prepare piles to be pounded into the ground at the New Jersey Wind Port in Lower Alloways Creek, South Jersey. | © RTO Insider LLC


The first phase of the port, on about 125 acres, will consist of two berths, a 35-acre marshaling yard and two parcels totaling 55 acres for manufacturing. The first phase of the construction will require 1,850 piles, each 110- to 120-feet long and weighing 100,000 pounds. About half of the piles are in place.

They will support a wharf able to handle 6,200 pounds per square foot, enough to take the weight of two or more turbine towers as they are assembled and readied for shipment out to the wind farm in an upright position.

The second phase will add two berths, a 35-acre marshaling yard and 70 acres of additional manufacturing space.

As construction advances, workers are dredging a nearly one-mile channel to a depth of 45 feet to take vessels from the port to the river’s main navigation route. Although that work has stopped at present, so as not to disturb sturgeon in the river, dredging will resume July 1 for the final push to get the port ready.

Scheduled Marshaling

The need for a custom port lies in the specifics of OSW project creation, the EDA says: Turbines are far larger and heavier than most cargo; a regular port berth typically cannot take the weight or size. And the best way to install turbines is to do most of the construction onshore and ship them to the wind farm upright, which requires a route that has no height restrictions, specifically bridges, on the relevant waterway.

Both Denmark-based Ørsted, which is developing the two Ocean Wind projects, and Atlantic Shores, a joint venture between EDF Renewables North America and Shell New Energies US, have signed letters of intent with the BPU to conduct marshaling for their respective ventures at the port.

When the second phase is finished, the port will be able to handle the marshaling for more than one project at once, but the timing of Ocean Wind I and Atlantic Shores, which were approved two years apart, is such that they are not expected to need marshaling space at the same time, Kennedy said.

“Typically, it takes two to three years to marshal for a project of 1 to 1.5GW,” Kennedy said. “The way this port is designed to work is obviously the marshaling parcels will keep getting flipped. Your new projects will come in, and they’ll take two- to three-year leases.”

The EDA determined that having the capacity to handle more than one project at a time was important, in part, to strengthen the state’s offshore wind sector by “ensuring that no one developer locked up the port,” preserving competition, Kennedy said.

“We want all bidders on the BPU solicitations to have marshaling port capacity available in New Jersey, should they be successful in that solicitation,” he said.

The third phase solicitation document makes clear the port’s importance to the state’s OSW ambitions.

“Consistent with New Jersey’s commitment to position the state as a regional offshore wind hub, the BPU strongly encourages use of the New Jersey Wind Port for project marshaling and for locating Tier 1 manufacturing facilities, where feasible,” the document says.

So far, Siemens Gamesa Renewable Energy (OTCMKTS: GCTAY), Vestas-American Wind Technology (OTCMKTS: VWDRY), Beacon Wind and GE Renewables — all prominent offshore wind players — have expressed interest in the past, but it is unclear whether that interest will move ahead. (See NJ Wind Port Draws Offshore Heavy Hitters.)

Kennedy says the EDA is bullish on the question of whether the massive investment is worth it.

“We think there’s going to be continued demand for marshaling, you know, out 20-, 30-plus years,” he said. “We feel like the pipeline of projects that will need marshaling capacity extends well into 2040, 2050 and beyond.”

Turbine Size Increasing

The need for space is fueled, in part, by the rapid increase in turbine size as technology evolves. While turbines deployed in Europe 25 years ago had a capacity of about 2MW, Ocean Wind 1 will use a 14 MW GE Haliade turbine with 360-foot-long blades and total height of 920 feet. Atlantic Shores will use a 15 MW turbine made by Vestas Wind Systems, with 380-foot-long blades.

“Turbines are getting bigger, more efficient, (with) increased output,” Kennedy said, adding that increased efficiency is good for ratepayers but adds to the burden on ports handling them.

“The weight-bearing capacity of the wharf, the dredge depth, the backlands, strength and acreage — all of those things don’t exist, typically, in a port,” he said. “So that’s why we’re building a port.”

The state picked the site from multiple options, narrowing their choices to the Delaware River site and a 50-acre site that formerly housed an oil-fired power plant in South Amboy, opposite Staten Island at the mouth of the New York harbor. The Delaware River site, on a tract that also includes three nuclear power plants operated by PSE&G, had several benefits, including the fact that it was a greenfield site, and so required little remediation, Kennedy said.

Another benefit is the lack of height-limiting bridges on the 60-mile trip between the port and the sea. Any height limitations from a bridge would require the turbines to be moved in a horizontal position by barge and elevated at the final destination, a more complicated, expensive and time-consuming process, he said.

In addition, the large space available at the New Jersey Wind Port, 220 acres, means turbines can be manufactured and assembled on-site.

“You’re effectively wheeling the components out of the factory doors, straight onto the marshaling parcel,” Kennedy said. “And that, again, is good news for ratepayers, because it means you can manufacture and install these components cheaper than if you had to, say, you know, manufacture them elsewhere.

“Time is money with offshore wind, in terms of vessel costs, and other factors,” he said. “You need a large acreage, because you need to get as many components in and lay them down as possible, so that they’re ready to be assembled and shipped back out. You don’t want to be waiting for pieces to arrive, because the installation vessel is so expensive.”

Growing Competition

Whether all that is enough to make the port attractive beyond state borders remains to be seen. Kennedy and others at the EDA said the state has a first-mover advantage and a prime location.

“Basically, we have fortuitously located geographically in the middle of the (East Coast) wind belt,” which now stretches from Maine to South Carolina, Kennedy said.

Yet, competing marshaling and manufacturing facilities are also emerging along the coast. Wind ports of some scale are planned for New Bedford, Mass., New London, Conn., and in New York, at the South Brooklyn Marine Terminal, from where turbines will have to head out to sea lying flat on a barge to pass under the 230-foot-high Verrazano Narrows Bridge.

The Port of Virginia in August allocated $223 million to the construction of a 72-acre port, with a staging area and 1,500-foot berth. And in Maryland, Ørsted and US Wind are investing in OSW port and manufacturing facilities at the Tradepoint Atlantic that Maryland Gov. Wes Moore announced in April “is on track to become the offshore wind capital of America.”

Kennedy, however, cited a 2022 study that suggested the region will need whatever port and marshaling facilities are developed.

The study, by two University of Delaware researchers, concluded that the need for marshaling facilities is a “key bottleneck” in the push to meet state and federal offshore wind policies. The researchers calculated that state and federal offshore wind commitments would create projects with a collective capacity of 40 GW by 2040, stimulating “more demand for marshaling area than is currently available or planned.”

“The shortage of marshaling area supply has incorrectly been attributed to lack of suitable U.S. locations,” the report said. “Instead, we attribute it to developers having built ports to support early, smaller projects … rather than developing ports for long-term, large-scale, and economically efficient use.”