The 2023 edition of a federal rooftop solar demographic report finds the median household income of people installing solar systems has decreased but is still well above the median American household income.
The Clean Energy States Alliance held a webinar Feb. 15 to discuss the data in the report, which is designed as a reference for policy makers and industry stakeholders.
The Lawrence Berkeley National Laboratory’s “Residential Solar-Adopter Income and Demographic Trends: 2023” is based on address-level data for 3.4 million residential solar systems installed through 2022, covering about 86% of residential systems.
Key takeaway points from the report:
-
- The documented income disparities are due in part to the rooftop solar industry concentrating on high-income states.
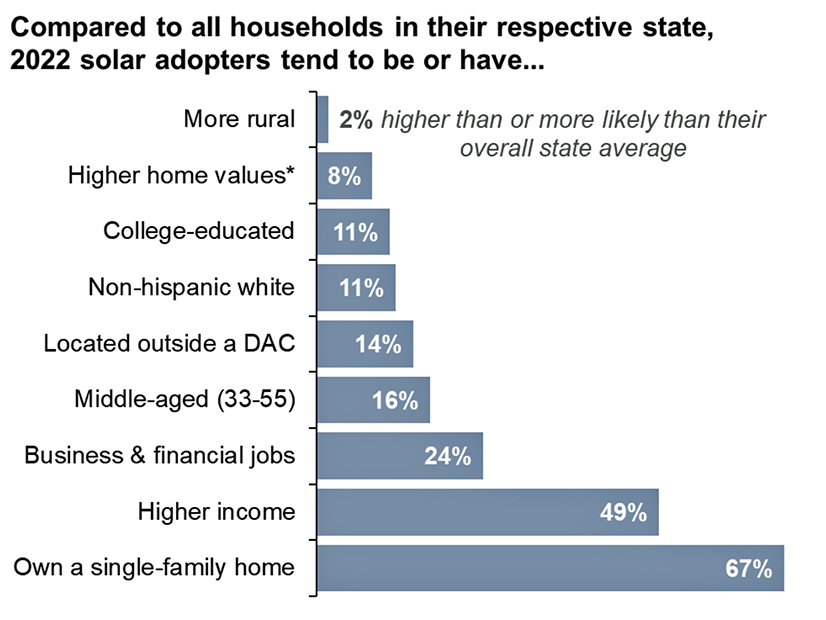
- Residential solar adopters are diverse, but many share a few common traits — they own a single-unit residence, occupy a higher income bracket, hold jobs in the business or finance sector, are middle aged and do not reside in a disadvantaged community.
- The differences between solar- and non-solar households are diminishing gradually as the industry reduces prices and expands into lower-income states and disadvantaged communities. The emergence of policies and business models that support broader adoption also helps.
Report co-authors Galen Barbose, Sydney Forrester and Eric O’Shaughnessy explained some of the findings during the webinar.
Barbose said the income gap between solar and non-solar is not as wide as it initially seems.
Median household income of solar adopters in 2022 was $117,000, compared with just $69,000 for all U.S. households.
But the median income was $86,000 for U.S. households that occupy housing they own, which is a better metric, because 94% of rooftop solar installations were on single-family owner-occupied homes.
Finally, the average owner-occupied income rises to $98,000 nationally once weighted for the number of solar installations in each state.
That’s not to say everyone with a solar panel on their roof earns a lot of money: In 2022, 43% of solar adopters had household incomes less than $100,000 and 12% reported incomes of less than $50,000.
“The main takeaway here is that solar adopters come from all parts of the income spectrum,” Barbose said.
“When thinking about these trends, we like to distinguish between two underlying dynamics that are at play: a broadening of solar markets as solar adoption expands into new parts of the country, as well as a deepening, where even within established markets, we see solar increasingly reaching less affluent households within the region.”
Median income for solar households dropped from $140,000 in 2010 to $117,000 in 2022. Over the same period, the percentage of rooftop solar adopters living in designated disadvantaged communities doubled from 11% to 22%.
One shortcoming of the data is that it cites mid-2023 income, rather than income at the time the solar panels were installed. It also does not account for ownership transfer: Some residents of solar-equipped houses bought those houses well after the panels were installed, so their income and other demographics had no bearing on the decision to install solar.
Forrester drilled down on three pronounced trends in the report:
Each of the successively higher income brackets presented had successively larger photovoltaic systems on average, successively higher rates of battery storage installed on site, and successively higher rates of ownership of the equipment, rather than leases or power-purchase agreements with a third-party owner.
In states other than California, median system size was 7.2 kW for households with annual income less than $50,000, gradually increasing to 9.2 kW for those with annual incomes above $200,000. This can be due to the higher cost of larger systems, the larger roof area often available in more expensive homes and the higher electrical demand often seen in higher-income households, Forrester said.
(California is a category unto itself, a high-income state that accounts for 42% of the installed systems analyzed nationwide in the report. It is not an accurate snapshot of America.)
O’Shaughnessy said the lower rate of solar adoption by lower-income households often reflects not a lack of interest in solar but a lack of money to pay for it.
Berkeley Lab analyzed this issue a few years ago, he said.
Looking at the incentives offered to low- and moderate-income (LMI) households, researchers found evidence “that not surprisingly, incentives do work. The catch there is that LMI incentives tend to be very small. So, it’s not really a scalable solution,” O’Shaughnessy said.
“Leasing or third-party ownership, a model that allows homeowners to adopt solar with no or little money down, the evidence suggests that was probably the biggest factor that opened up the market to LMI households,” he said. “That is also a policy decision — not every state allows third-party ownership.”
O’Shaughnessy added: “We continue to look at questions of why there is lots of low-income adoption in certain places, not others.”
Data for the report were gathered from the U.S. Census Bureau; the U.S. Bureau of Labor Statistics; the White House Council on Environmental Quality’s Climate and Economic Justice Screening Tool; Berkeley’s own Tracking the Sun database; BuildZoom and Ohm Analytics; and an Experian ConsumerView dataset purchased for the project.
Berkeley Lab’s online portal allows public analysis of the demographic data.


