Search
`
November 13, 2024

ERCOT, PUC Face Huge Tx Needs in Permian

ERCOT told Texas regulators their initial reliability study of the Permian Basin, the nation’s largest oil production field, indicates “substantial amounts” of local transmission projects are needed to meet the 24 GW of load projected to be added by 2038. 

During the Public Utility Commission’s open meeting April 11, the grid operator’s Kristi Hobbs said it will have to add about 565 circuit miles of new 345-kV lines, eight new 345/138-kV substations with 18 new 345/138-kV transformers and about 344 miles of new 138-kV lines. ERCOT also needs to upgrade about 326 miles of existing 345-kV lines (55718). 

None of that includes “significant” regional upgrades needed to transfer power across the ERCOT system. The grid operator said it will begin identifying import paths into the Permian. 

“There is not a lot of generation within the Permian Basin region to serve all the additional load that is being forecasted,” Hobbs, vice president of system planning and weatherization, told the commissioners. “We will continue looking at revising the plan for the local region as well as coming to you … for what is going to be needed for imports across the state into the region.” 

Hobbs said 58% of the nearly 12 GW of expected non-oil and gas load is composed of crypto mining facilities. Green hydrogen represents 22% of the coming load, with commercial industrials accounting for 12% and data centers 8%. 

“This is just one example of what we’re going to continue to see throughout the rest of the state as we look at reliability plans,” Commissioner Lori Cobos said. 

The PUC last year directed ERCOT to develop a reliability plan for the Permian Basin, a response to legislation passed earlier in 2023 to address the region’s rapidly increasing demand for power. The commission prioritized the plan’s development as it addresses the state’s population and economic growth. 

Saying he senses ERCOT conducts its various modeling studies in silos, Commissioner Jimmy Glotfelty asked Hobbs whether staff could combine some of that analysis. 

“I think this will have an impact on inverter-based resources [in the Permian],” he said. “It will have [an] impact on what we can import to that area and export out of that area, and I just think we need to have a better picture with all of those things modeled together.” 

Hobbs said one of ERCOT’s key goals is evolving the transmission planning process. Staff already are studying 765-kV transmission lines and their integration into the grid. Hobbs promised a report will be delivered to the commission this summer. 

“We’re moving on a fast timeline,” she said. “We recognize the tremendous load growth on the system. We also recognize that the types of resources that are being added to this system are not the traditional resources that we want to plan for. We are looking at ways that we can continue to evolve the process to meet the needs for the fast-growing state.” 

The Permian Basin encompasses 66 counties in southeastern New Mexico and western Texas. It produces nearly 40% of the nation’s oil and roughly 15% of its natural gas, according to the Federal Reserve Bank of Dallas. 

Other Business

In other actions during the open meeting, the PUC approved a 150-MW El Paso Electric (EPE) solar facility (54929) and Xcel Energy subsidiary Southwestern Public Service’s (SPS) rate case (54634). 

EPE’s Texas Solar One is composed of two components: a 50-MW portion the utility plans to dedicate to a voluntary subscription program and a 100-MW portion to serve retail customers. Under an agreement with the city of El Paso, the Office of Public Utility Counsel and Texas Industrial Energy Consumers, EPE will place a capital cost cap on the facility and add a performance guarantee and a commitment to credit its customers with 100% of Texas Solar One’s production tax credits. 

The commission signed off on an unopposed agreement between SPS and various parties that provides for a $65 million increase in the utility’s Texas retail revenue requirement.  

FERC Approves Decrease in ISO-NE FRM Offer Cap

FERC has approved a proposal by ISO-NE reducing its Forward Reserve Market (FRM) offer cap from $9,000/MW-month to $7,100/MW-month and delaying the publication of offer data from about four months to a year after each auction (ER24-1245). 

ISO-NE designed the market changes in response to concerns raised by its Internal Market Monitor that recent summer FRM auctions had been “structurally uncompetitive” and that future auctions could be susceptible to market power. 

FRM auctions, held twice annually to procure reserve capacity, will be replaced by ISO-NE’s new day-ahead ancillary services market in March 2025. (See FERC Approves ISO-NE’s Day-Ahead Ancillary Services Initiative.)  

The IMM concluded the previous $9,000 offer cap “substantially overstates a reasonable upper bound on competitive forward reserve supply offers,” while the shorter timeline for offer publication “may provide strategic information to participants” in subsequent auctions.  

In an April 12 order, FERC found that the offer cap reduction provides “sufficient flexibility for resources to participate at their expected costs within the upper end of a competitive offer, while also providing protection from the potential exercise of market power.” 

Then commission also found the delay of offer data publication “balances the need for market transparency with the need to limit the possibility that market information may lead to noncompetitive outcomes.” 

The changes take effect on April 15, 2024, in time for the opening of the first 2024 FRM auction April 17. 

Nevada RTO Proceeding Examines EDAM, Markets+ Design

Two competing day-ahead markets from CAISO and SPP are taking different approaches to resource sufficiency and adequacy, according to presenters at a workshop included in an effort that will likely help shape NV Energy’s decision on which market to join. 

The Public Utilities Commission of Nevada (PUCN) hosted the workshop April 10 to discuss regional market designs. 

In CAISO’s Extended Day-Ahead Market (EDAM), balancing areas will undergo a daily resource sufficiency evaluation (RSE) ahead of the market’s 10 a.m. cutoff.  

The balancing areas will work with their load-serving entities and suppliers to ensure sufficient resources and transmission are available to the market, said CAISO Chief Operating Officer Mark Rothleder. The resources must be enough to meet the demand forecast, plus an operating reserve and an imbalance reserve. 

Resources from all participating balancing areas will then be optimized to meet demand across the market and minimize cost, Rothleder said. Entities that don’t pass the RSE will still be able to participate in the market but will be charged a premium. 

In contrast, SPP’s Markets+ day-ahead market will not use a daily resource sufficiency test, said Carrie Simpson, SPP’s director of services development. 

Instead, all load-serving entities in Markets+ must belong to Western Power Pool’s Western Resource Adequacy Program (WRAP), which SPP runs.  

The WRAP includes a forward-showing component that will require participants to demonstrate they have sufficient capacity and 75% of the transmission needed to deliver it seven months before each summer and winter. Those who fail the requirement will face penalties. 

Simpson said obligations coming out of WRAP will inform a day-ahead market participant’s must-offer requirement, “so that we ensure that we have sufficient generation offered into the market.” 

SPP “heard loud and clear” from entities participating in the development of Markets+ about the need for a uniform resource adequacy program, Simpson said. 

“In Markets+, we have a uniform approach so everyone’s on the same playing field,” Simpson said. “To the extent that someone is short today, well, they’re part of the larger program, and we’ll have the capability to have someone else offer for them, and so you get that shared pooling advantage.” 

Rothleder, with CAISO, described EDAM’s resource sufficiency evaluation as “a universal adapter” that can accommodate WRAP, California’s resource adequacy requirements or other RA programs. 

Resources developed under the RA programs can then be used to satisfy resource-sufficiency evaluations, he said. 

“I am not suggesting resource adequacy programs are not important. They are very important,” Rothleder said. “All I’m suggesting is that you don’t have to have a one-size-fits-all resource adequacy program for a day-ahead market optimization to work.” 

The RSE may even be a way to compare different resource adequacy programs, Rothleder suggested. 

“To the extent that the resource adequacy program is performing less than another resource adequacy program, that will be tested by the resource sufficiency evaluation,” he said. 

Competition Heats up

The workshop was part of PUCN’s efforts to find ways to evaluate a utility’s choice of a regional market or RTO. An April 3 workshop focused on studies of day-ahead market benefits. (See Nev. RTO Effort Turns Focus to NV Energy Day-ahead Studies.)  

NV Energy and other utilities across the West are drawing closer to decisions on which day-ahead market to join. Some have already chosen. 

PacifiCorp, the Balancing Authority of Northern California (BANC) and Portland General Electric are among the entities pursuing EDAM membership. CAISO is aiming to launch EDAM in 2026. 

Bonneville Power Administration staff tentatively recommended this month that the agency go with Markets+. (See BPA Staff Recommends Markets+ over EDAM.) 

NV Energy hasn’t revealed publicly its day-ahead market choice. The utility was among more than three dozen entities that participated in developing tariffs and protocols for Markets+, in a process SPP calls Phase 1, but a recent study by The Brattle Group found the utility would realize greater financial benefits from joining EDAM. (See NV Energy to Reap More from EDAM than Markets+, Report Shows.) 

Phase 2, expected to start next year, will begin Markets+ implementation, with a go-live date projected for early 2027. 

Antoine Lucas, SPP’s vice president of markets, said SPP is asking its Phase 1 participants to indicate this quarter whether they’ll be moving forward with Markets+, even if their commitment is nonbinding at this point. 

“I know there is some level of … participants looking to each other to see what they might do,” Lucas said during the workshop. 

When asked what level of participation would be needed to make Markets+ feasible, Lucas said Phase 1 participants decided that 150 TWh of net energy for load annually and two contiguous balancing areas would be enough to move forward. 

WEIS’ Role Clarified

Some entities that join Markets+ might now be participating in CAISO’s real-time Western Energy Imbalance Market (WEIM). In that case, they would leave the WEIM and instead participate in a real-time market that is bundled with the Markets+ day-ahead market. 

The real-time market associated with Markets+ is different from SPP’s Western Energy Imbalance Service (WEIS), a real-time market now in operation, SPP officials noted during the workshop. 

Current WEIS participants, mainly from Wyoming and Colorado, are expected to join Markets+ or SPP’s planned Western RTO expansion, known as RTO West. At that point, SPP expects to discontinue the WEIS, Simpson said. 

Counterflow: Offshore Wind Backbone Transmission

The U.S. Department of Energy released a study of offshore wind transmission last month,1 which it said charts a path for a reliable and affordable electric system with HVDC backbone transmission interconnecting offshore wind projects along the East Coast.2 (See DOE Study Adds to Case for Interregional Offshore Grid.)

For starters we need to be clear: In no way does this study establish, or even claim, that offshore wind makes economic sense. Of course it couldn’t, for reasons I’ve given before,3 which are reinforced by all the news of the past year or so.4 Instead, we should be building onshore wind and, where economic, transmitting it from west to east.

What the study actually claims is that hypothetical offshore wind projects of 85 GW along the East Coast, if interconnected among themselves with an offshore transmission “backbone,” would have a positive cost-benefit ratio relative to 85 GW of wind projects separately interconnected to shore with “radial” lines.

In other words, the study claims that if we were to spend $96.3 billion5 on radial transmission lines for 85 GW of offshore wind, it would make sense to spend another $20 billion for offshore north-south HVDC transmission lines to interconnect everything offshore — and, oh yeah, based on year 2050 projections of everything.

Now let’s get to some specific problems with the study.

Legal and Commercial Barriers

Because offshore wind is so expensive, it happens only with large customer (and taxpayer) subsidies through a given state procurement program. For example, in New Jersey’s latest procurement, the developer is receiving $131/MWh in offshore wind renewable energy credits (ORECs) with a price escalator.6 Such procurements effectively or literally require all the wind generation to be delivered to the procuring state.7

Even if a developer were legally able to divert some generation elsewhere, it would have no reason to do so under programs like New Jersey’s where all project revenues are credited back to customers.8 And even if there were no revenue-crediting requirement, a developer isn’t going to divert wind generation elsewhere, such as to New York, except in hours when it could get more than $131/MWh.9 This rarely occurs, and when it does, it is likely that energy prices in New Jersey also would be high.

Energy Price Differences

Assuming the above legal and commercial barriers didn’t exist, let’s examine the study’s principal economic benefit claim: There are huge price differences between different East Coast regions such that there are huge customer savings to be had from moving power up and down the East Coast for injection onshore at different points. “In modeled estimates using the radial topology in 2050, price differences between suitable POIs [points of interconnection] for offshore wind averaged over $100/MWh”;10 for example, “approximately $130/MWh on average between ISO-NE and SERC.”11

This appears to be a mistake. For the year 2050, DOE’s Energy Information Administration projects average generation sector prices of $66.8/MWh in New England and $54.7/MWh in SERC East (South Carolina and the non-PJM portion of North Carolina).12 That is a difference of about $12/MWh, not $130/MWh. The biggest regional price difference is between New England and PJM-East (which contains New Jersey and the Delmarva Peninsula) with a difference of about $16/MWh.13 So there are no $100/MWh average regional price differences that an offshore transmission backbone could arbitrage for the benefit of customers.14 And even if there were, stakeholders subsidizing their state’s wind projects would be none too happy for their wind to be diverted elsewhere in times of high prices.

Oh, by the way, the study’s specific quantifications of customer energy savings are based on a production cost model.15 But, except for the Carolinas and Virginia, customers don’t pay production costs; they pay LMPs.

And the study also implicitly assumes, contrary to actual experience, that resources could and would be dispatched efficiently among regions.16

Resource Adequacy

The study’s second biggest category of claimed benefits is resource adequacy. The study claims $940 million of incremental annual resource adequacy benefit in 2050, relative to a radial transmission design.17 The prime example is that PJM could rely on wind off the Carolinas to be delivered to PJM during peak conditions so the RTO would need less internal generation capacity.18

This also appears to be a mistake. PJM has FERC-approved capacity market rules to ensure resource adequacy that require external generation resources to give operational control to PJM so that external resources are functionally equivalent to internal resources.19 Stakeholders in wind projects off the Carolinas are not going to give PJM operational control.

And if I might pick a nit, the study says Carolina wind would be delivered to “winter-peaking parts of PJM” and specifies Maryland.20 None of the coastal states in PJM are winter peaking, including Maryland.21

Modeling Assumptions

The study has a couple modeling assumptions that seem to put thumbs on the scale.

First, the study assumes “limited [new onshore] interregional transmission.”22 Yes, despite new onshore interregional transmission being all the rage these days, the study assumes nothing is built for the next 26 years.23 If new onshore interregional transmission were built, any price/cost differences would decline as more energy would be deliverable from low-cost areas to high-cost areas, and backbone offshore transmission would be less valuable.

Second, the study assumes “limited-access siting regimes for land-based wind and utility photovoltaics.”24 This assumption is not explained, but it seems safe to observe that if one assumes limited onshore renewable resources, offshore resources will look more attractive. This assumption is belied by the hundreds of gigawatts in proposed onshore renewable resources.25

Incremental Annual Cost

In developing its benefit-cost ratios, the study doesn’t provide detail for its capital costs.26 But the study does drop a footnote for its assumptions on converting capital costs to annual costs,27 and we can back into the annual costs. So, for example, comparing the radial scenario with the backbone scenario, we know that if claimed incremental “economic value” is $3,940 million28 and if claimed incremental “net annual value” is $2,470 million,29 then the implied annual cost is $1,470 million.

If the incremental capital cost is $20 billion and the annual cost is $1,470 million, then that means the assumed annualized cost percentage is 7.35%. But that is not realistic. For example, the annual carrying charge rate for transmission owners in PJM is about 11.8%,30 and annual O&M expense is on top of that.

Engineering Feasibility

I am no engineer, but there is an Argonne National Laboratory study that says HVDC systems can’t have more than five substations: “The number of substations within a modern multi-terminal HVDC transmission system can be no larger than six to eight, and large differences in their capacities are not allowed. The larger the number of substations, the smaller may be the differences in their capacities. Thus, it is practically impossible to construct an HVDC transmission system with more than five substations.”31 And National Grid describes major issues with multi-terminal HDVC systems.32

The DOE backbone design has 26 substations.33 How does that reconcile with the Argonne and National Grid analyses? I have no idea, but these are things the study should have addressed.

And there’s another potential engineering issue called the “most severe single contingency,” which involves the sudden loss of a single source of electric generation, generally around 1,200 MW. It is unexplained how aggregated offshore wind generation delivered onshore in excess of the MSSC would not trigger reliability and reserve issues.

What Else Could Possibly Go Wrong?

Spend $20 billion here, $20 billion there, and pretty soon we’re talking real money. And those who might rationalize spending “only money” on offshore wind backbone transmission should consider how much a focus on standard design among offshore transmission projects, in order to enable backbone transmission, might delay or even frustrate such projects.

In Conclusion

DOE should rethink this.

Columnist Steve Huntoon, principal of Energy Counsel LLP, and a former president of the Energy Bar Association, has been practicing energy law for more than 30 years.


[1] https://www.nrel.gov/docs/fy24osti/88003.pdf.

[2] https://www.energy.gov/articles/doe-reports-chart-path-east-coast-offshore-wind-support-reliable-affordable-electricity.

[3] Offshore wind is more than twice as expensive as onshore wind and is a highly inefficient use of renewable energy subsidies. https://www.energy-counsel.com/docs/we-see-through-a-glass-darkly.pdf, citing https://www.lazard.com/media/kwrjairh/lazards-levelized-cost-of-energy-version-140.pdf, slide 3, showing $40/MWh for onshore wind versus $86/MWh for offshore wind (midpoints of the ranges). The most recent Lazard levelized cost of energy analysis is $49/MWh and $106/MWh, respectively, https://www.lazard.com/media/typdgxmm/lazards-lcoeplus-april-2023.pdf, slide 2. My earlier column criticized subsidies/mandates for offshore wind and showed that for every dollar of subsidy, we can get 11 times as much onshore wind as offshore wind. http://energy-counsel.com/docs/Offshore-Wind-Edifice-Complex.pdf.

[4] An excellent article covering this news, as well as discrediting the jobs argument for offshore wind, is here, https://www.cato.org/regulation/spring-2024/false-economic-promises-offshore-wind

[5] In a couple footnotes, 25 and 29, the study says “million” instead of “billion.” This is confusing.

[6] https://www.offshorewind.biz/2024/01/25/new-jersey-selects-3-7-gw-of-new-offshore-wind-projects-awards-inflation-adjusted-orec-contracts/.

[7] For example, in New Jersey the points of landfall and interconnection are required to be in New Jersey. https://njoffshorewind.com/third-solicitation/solicitation-documents/Att-5-Application-Requirements.pdf, page 13. In New York the requirement is explicit, https://www.nyserda.ny.gov/All-Programs/Offshore-Wind/Focus-Areas/Offshore-Wind-Solicitations

[8] https://njoffshorewind.com/third-solicitation/solicitation-documents/Att-5-Application-Requirements.pdf, page 18.

[9] ORECs are only paid for wind energy delivered to New Jersey. https://njoffshorewind.com/third-solicitation/solicitation-documents/Att-4-Offshore-Wind-Economic-Development-Act.pdf, page 17.

[10] https://www.nrel.gov/docs/fy24osti/88003.pdf, page ix.

[11] https://www.nrel.gov/docs/fy24osti/88003.pdf, page 47.

[12] https://www.eia.gov/outlooks/aeo/tables_ref.php, comparing Tables 54.7 and 54.10 in year 2050 for generation sector prices in 2022 cents per kilowatt-hour and converting to dollars per megawatt-hour.

[13] From north to south, EIA projects average generation sector prices in 2050 to be: $66.8/MWh in NPCC-New England, $61.8/MWh in NPCC-New York City and Long Island, $50.7/MWh in PJM-East, $50.8/MWh in PJM-Dominion, and $54.7/MWh in SERC-East. Tables 54.7, 54.8, 54.10, 54.13 and 54.14.

[14] Perhaps the study meant to say that there are some hours with at least a $100/MWh price difference and that the average price difference of those hours is more than $100/MWh, which of course it would be by definition. Who knows?

[15] DOE Study, page v and footnote 2.

[16] https://www.brattle.com/wp-content/uploads/2023/10/The-Need-for-Intertie-Optimization-Reducing-Customer-Costs-Improving-Grid-Resilience-and-Encouraging-Interregional-Transmission-Report.pdf; https://www.rtoinsider.com/75385-stakeholder-soapbox-greatest-machine-needs-tune-up/

[17] DOE study, Table 19 on page 77.

[18] DOE study, page 70.

[19] https://elibrary.ferc.gov/eLibrary/filedownload?fileid=E921C275-FFCB-C00E-9D23-7D6D72D00000

[20] DOE study, pages 67 and 70.

[21] https://www.pjm.com/-/media/library/reports-notices/load-forecast/2024-load-report.ashx, Tables B-1 and B-2. Taking Maryland as the example given in the study, the summer peak loads for the furthest year out, 2039, are 7,495 MW for Baltimore Gas and Electric and 6,870 MW for Potomac Electric Power Co., relative to their respective winter peak loads of 6,803 MW and 6,081 MW.

[22] DOE study, page 9.

[23] DOE study, page 12.

[24] DOE study, page 9.

[25] https://www.nerc.com/pa/RAPA/ra/Reliability%20Assessments%20DL/NERC_LTRA_2023.pdf, Figure 16.

[26] Basic stuff like number of substations, total transmission miles, etc.

[27] DOE study, page 77, footnote 37.

[28] DOE study, Table 19 on page 77.

[29] DOE study, Table 20 on page 77.

[30] https://www.pjm.com/-/media/committees-groups/committees/teac/2023/20230711/20230711-informational—market-efficiency-analysis-assumptions—july-2023.ashx

[31] https://publications.anl.gov/anlpubs/2008/03/61117.pdf, page 42.

[32] https://www.nationalgrid.com/sites/default/files/documents/13784-High%20Voltage%20Direct%20Current%20Electricity%20%E2%80%93%20technical%20information.pdf, page 6. An interesting story is here, https://spectrum.ieee.org/multiterminal-hvdc-networks

[33] DOE study, page 52.

NY Energy Officials Optimistic About Transition Despite Slow Progress

ALBANY, N.Y. — Regulators, state officials and industry were upbeat about New York’s efforts to decarbonize its grid at the annual New York Energy Summit, staged by Infocast on April 8-10, even as they repeatedly noted that much work needs to be done — namely, building more renewable resources and transmission lines. 

Like many states, New York has committed to expanding generation and transmission capacity while simultaneously reducing emissions. For professionals in the field — whether their motivation is profit, the planet or some combination of factors — the Empire State is a target-rich environment. But the targets are not easy to meet. 

Once again, state leaders have missed their March 31 budget deadline. As of press time, the state still had no 2024-2025 spending plan and therefore no clear indication which policy initiatives will be baked into it, including the proposal by Gov. Kathy Hochul (D) to speed up transmission siting. (See NY Gov. Proposes Streamlined Transmission Review, Permitting.) 

John O’Leary, the governor’s deputy secretary for energy and environment | © RTO Insider LLC

John O’Leary, Hochul’s deputy secretary for energy and environment, delivered a keynote overview of the state’s energy transition but could not give summit attendees any insight on proposals that would affect their business strategies. 

“In the parlance of New York state budget making, you might say today is not in fact April 8 but instead March 39,” he said. “We’re certainly into extra innings.” 

Vennela Yadhati, vice president of renewable project development for the New York Power Authority, said Hochul’s transmission streamlining proposal — the Renewable Action Through Project Interconnection and Deployment (RAPID) Act — is critical to the state meeting its statutory targets for decarbonization. The first milepost, 70% renewable energy by 2030, is just six years away, and New York is still far short. 

“I’m sure that you all agree with me that we need this legislation enacted if New York is going to meet its goals,” Yadhati said. 

Faster and Smoother

The RAPID Act would place environmental review and permitting of transmission projects under the purview of the state Office of Renewable Energy Siting (ORES), which in its four years of existence has greatly accelerated the application process for large-scale renewables. 

Houtan Moaveni, N.Y. Office of Renewable Energy Siting | © RTO Insider LLC

The ORES pre-application process can be lengthy, but it yields an application that is complete and can withstand the close review to which it will be subjected. ORES so far has permitted 15 projects totaling 2.3 GW, the majority of them in less than eight months, Executive Director Houtan Moaveni said. 

“It takes longer to get a heated pool permit in Westchester County than a 500-MW solar project in New York state,” he added. 

An ORES permit is an important milestone, but it is just one piece of a large puzzle. With the impending retirement of more fossil fuel-fired plants, New York needs more generation and transmission capacity immediately, Moaveni said. 

“I’m preaching to the choir,” he told the room. “We really, really have to accelerate the pace of development in New York state.” 

NYISO President Rich Dewey | © RTO Insider LLC

The choir had some prominent members, including the federal and state energy regulatory agency heads and NYISO CEO Rich Dewey. 

FERC Chair Willie Phillips waved the flag for the commission’s own efforts. “We took the best parts of interconnection reform from every part of the country, and no one part of the country is doing … everything that we’re requiring in Order No. 2023,” he said. 

Dewey said NYISO had a head start on Order 2023 compliance and spoke proudly about the ISO’s improvement in managing its queue. 

“When Order 2023 came out, we welcomed that, because we had already been at it for about a year in terms of trying to get our processes fine-tuned,” he said. “We’re happy to report that our SRIS [system reliability impact study] process last year took an average of 132 days. The average of the three years preceding that was 420 days.” 

When asked what differentiated NYISO’s transmission planning from those of other grid operators, Dewey touted the ISO’s “very, very robust” process for identifying reliability needs and New York’s Public Policy Transmission Needs process, in which the state solicits projects and the ISO evaluates and selects the best solution. 

“In the middle of that, we have our economic planning process, and I think that’s where our gaps have been,” he continued. NYISO’s System & Resource Outlook lays out multiple scenarios that might unfold over the next two decades and identifies pathways through them, he said. 

N.Y. Public Service Commission Chair Rory Christian | © RTO Insider LLC

It is not an action plan, however. “We don’t have a means to act on that today; it’s more informational,” Dewey said. (See NYISO 20-Year Forecast Highlights Generation, Tx Hurdles to Climate Goals.) 

But the present practice of building transmission one interconnection at a time as needed is neither efficient nor effective, Dewey said. Measures such as proactive infrastructure construction and New York’s new Coordinated Grid Planning Process (CGPP) will address this, he said. (See NY Creates Coordinated Grid Planning Process.) 

Zeryai Hagos, of the state Department of Public Service, explained that the CGPP will attempt to integrate the distribution, local transmission and bulk transmission planning processes on a repeating cycle to identify upcoming infrastructure needs. 

New York Public Service Commission Chair Rory Christian spoke of the imperative to think beyond interconnections and conductors when developing the grid of the 21st century. 

New York energy

Yachi Lin, NYISO | © RTO Insider LLC

If demand-side management isn’t used, that grid must be overbuilt or overused to handle peak load, with a proportionally greater impact on equipment, the environment and ratepayers. 

“Addressing the rise in peak load … is central to the commission’s ability to ensure affordable, safe, secure and reliable access to utility services and just and reasonable rates,” he said. “Our ability to control the peak gives us flexibility that we would otherwise not have. This is the challenge the grid of the 21st century is being designed to meet.” 

NYISO’s Yachi Lin said the ISO’s upcoming report on capacity and transmission constraints will predict a need for 100 to 130 GW of installed capacity in New York in 20 years. This compares with approximately 37 GW of existing generating capability identified by the NYISO Gold Book in April 2023. 

Glenn Haake, vice president of regulatory affairs at Invenergy, applauded the PSC for creating the CGPP and for greenlighting billions of dollars’ worth of transmission projects after decades of minimal investment. 

New York energy

FERC Chair Willie Phillips | © RTO Insider LLC

John Howard, who recently completed a term as a PSC commissioner, said transmission investments have long been trimmed when utility regulators review rate cases. As a result, he said, some conductors in New York are as old as he is. 

“It’s certainly something that commissions knew was dropping off the table,” Howard said. 

Christian and many others have spoken of this problem as a way of easing customers’ sticker shock over the costs of the energy transition: The nation’s grid would need extensive and expensive investments even without an energy transition. 

Energy transition challenges notwithstanding, the grid does function well, NYISO COO Emilie Nelson said. 

“One of the things that we do have in New York is we’ve invested in a lot of capability through the years. Our interconnected grid — our ability to move power across each and every border of New York to the neighboring areas — serves us well.” 

DOE Releases New Efficiency Standards for Light Bulbs

The Department of Energy has released finalized energy efficiency standards for “general service lamps, which include the most common types of commercial and residential light bulbs.” 

The congressionally mandated standards go into effect in July 2028 for newly produced bulbs and are expected to save $1.6 billion annually on energy costs, cut waste and avoid carbon emissions. Over 30 years, DOE projects the standards will save more than $27 billion on utility bills and cut 70 million metric tons of carbon emissions. 

“Making common household appliances more efficient is one of the most effective ways to slash energy costs and cut harmful carbon emissions,” Energy Secretary Jennifer Granholm said in a statement April 12.  

DOE continues to implement the law on efficiency standards, and so far under the Biden administration, it has promulgated standards that cumulatively save $1 trillion in energy costs over 30 years and could save the average family $100 a year through lower utility bills. The standards cumulatively will cut 2.5 billion metric tons of greenhouse gas emissions, which is equivalent to 22 coal plants, over 30 years. 

The standards increase the efficiency level from 45 lumens per watt to more than 120 lumens per watt for the most common light bulbs, which DOE said is in line with industry trends shifting toward more efficient and longer-lasting LED bulbs. The new standards will save 4 quadrillion BTUs, or 17%. 

The department already has implemented efficiency standards that cannot be met by old, inefficient incandescent bulbs and were specifically directed by the Energy Independence and Security Act of 2007. The standards issued April 12 are part of a congressional requirement that DOE regularly review efficiency standards to ensure consumers benefit from technological improvements. 

The new standards can be met with a broad variety of LED bulbs, but not compact fluorescent bulbs (CFLs), which the market is transitioning away from. LEDs last longer, use less energy and do not contain mercury like CFLs. 

The American Council for an Energy Efficient Economy (ACEEE) welcomed the standard and noted that most light bulbs on the market are LED. A common bulb equivalent to old 60-watt models will use no more than 6.5 watts under the new standards once they go into effect. Many LED models today use 8 to 10 watts, while the harder-to-find compact fluorescents use about 13 watts, ACEEE said. 

“LED technology has gotten even better in recent years, and these standards will ensure that all products on the market catch up with the latest efficiency advances,” said Andrew deLaski, executive director of ACEEE’s Appliance Standards Awareness Project. 

MISO Offers 2-stage Plan for DER Aggregations in Markets

MISO hopes it can use a two-step approach to Order 2222 compliance, first using a demand response category in 2026, with full market participation of aggregations of distributed resources still on the RTO’s original 2030 timeline that FERC refused last year.  

MISO revealed at an April 11 DER Task Force teleconference the near-final revised Order 2222 compliance plan it intends to file with FERC. 

The RTO has divided its plan to allow DER aggregations in its markets into two parts. First, it plans to use an existing demand response resource participation category to get aggregations of distributed resources participating sooner, albeit on a limited basis. MISO said it can begin registering DER aggregations under its demand response resource participation model by Sept. 1, 2026, and begin participation by June 1, 2027.  

For demand response participation, DER aggregations must be at least 1 MW and MISO would commit them for either energy or contingency reserves. 

A few years later, MISO would roll out its comprehensive Distributed Energy Aggregated Resource model at the beginning of 2030. It plans to register aggregations beginning June 1, 2029, allow DER aggregations to participate in its energy and ancillary services by Jan. 1, 2030, and finally open capacity market participation to aggregations by June 1, 2030.  

MISO’s Marc Keyser said though stakeholders might think the deadline remains unchanged from the one FERC rejected last year, this proposal has the RTO working on the necessary changes to its settlements system this year to incorporate aggregations. (See FERC: MISO’s 2030 Finish Date on Order 2222 Compliance not Soon Enough; Stakeholders Ask MISO to Share New Order 2222 Go-live Date ASAP.)  

However, MISO would not adopt a wide-ranging, multinodal approach for aggregation. Aggregations would be limited to multiple nodes within a single load-balancing authority and a single load-serving entity, as they are today under its demand response resource model.  

“Adding more locations adds complexity,” MISO’s Kim Sperry said. She said the complexity is not limited to the RTO, but seeps into aggregators and distribution utilities’ processes.  

Sperry said MISO keeping its DER aggregation locational limits in line with its demand response resource rules allows it to not take on “too much too fast.” 

“We’re not trying to bring something brand new to the stakeholder community,” she said.  

Some stakeholders questioned why MISO needs three years of prep work to employ an existing resource model for DER aggregations.  

MISO DER Program Manager Paul Kasper said MISO needs time to complete a new, “foundational” settlement system tool to accept DER aggregations. 

Other stakeholders said the 1-MW size minimum seemed restrictive and pointed out that some states in MISO’s footprint prohibit aggregators from providing demand response and effectively would be shut out of the markets until 2030. 

MISO no longer accepts stakeholders’ written opinions on its revised Order 2222 implementation plan and has until May 10 to file its new compliance. It will present its final compliance plan to stakeholders at the April 18 Market Subcommittee. 

Still More Work for ISO-NE on Order 2222 Compliance

FERC on April 11 accepted ISO-NE’s fifth Order 2222 compliance filing while requiring the RTO to make additional changes detailing deadlines for distributed energy resource aggregators to submit metering data (ER22-983-007). 

Order 2222 aims to enable DER aggregations to participate in regional wholesale markets. FERC wrote that ISO-NE’s proposal met the requirements to make DER aggregators responsible for providing required metering information to the RTO, and to create standards for aggregators that work with host utilities to share these data. 

However, the commission concluded that ISO-NE did not meet the requirement to change its tariff to specify data submission responsibilities and deadlines, disagreeing with its contention that these instead should be included in the RTO’s manuals. 

“ISO-NE fails to address adequately the commission’s finding in the Nov. 2 order [the RTO’s third compliance filing] that the meter data submission deadline is a key component of metering practices for DER aggregators that should be included in the basic description of metering practices in the tariff,” FERC wrote.

ISO-NE in February 2022 submitted its first compliance filing to Order 2222, issued in November 2021. FERC directed additional changes, which the RTO submitted in three batches last year. The commission accepted the second and fourth filings without requiring any changes, but it ordered another round in response to the third. (See FERC Accepts ISO-NE Order 2222 Compliance Filing.) 

ISO-NE has 60 days to submit its sixth filing. 

EPA: US GHG Emissions Rose 1.3% in 2022

The topline figures from EPA’s new inventory of U.S. greenhouse gas emissions from 1990 to 2022 ― released April 11 ― show the country’s slow and uneven progress toward President Joe Biden’s goal of cutting emissions by 50 to 52% below 2005 levels by 2030. 

The U.S. has cut its greenhouse gas emissions by a modest 16.7% since 2005, and in 2022, total GHG emissions edged up 1.3% over 2021 levels as the economy continued to rebound from the COVID-19 pandemic, the report says. 

Carbon dioxide accounted for 80% of the country’s 5,489 million metric tons (MMT) of GHG emissions in 2022, with 93% of that coming from the burning of fossil fuels. 

In second place, methane emissions accounted for 11%, with 27% of that produced by farm animals ― cows, sheep and goats ― and 25% from natural gas infrastructure. Methane has 28 times the global warming potential of CO2. 

The remaining 9% came from a mix of lesser GHGs, all with high global warming potential. Nitrous oxide, which makes up 6% of total emissions, has a global warming potential 265 times higher than CO2. 

EPA compiles the report annually to be submitted to the U.N. Framework Convention on Climate Change by April 15, the deadline for developed countries to send in their inventories, according to a press release announcing the report. Biden’s 2030 goal is part of the U.S.’ commitment to reducing its greenhouse gases made under the 2015 Paris Agreement. 

Signed by 194 countries and the EU, the agreement commits the countries to limiting global temperature increases to 2 degrees Celsius over preindustrial levels at a minimum, with a preferred target of 1.5 C. 

The report was produced “in collaboration with numerous experts from other federal agencies, state government authorities, research and academic institutions, and industry associations,” according to Joseph Goffman, assistant administrator for the Office of Air and Radiation. 

Breakdown by Sector

The report’s analysis of emissions by economic sector provides some insights into the drivers for emission increases and decreases. 

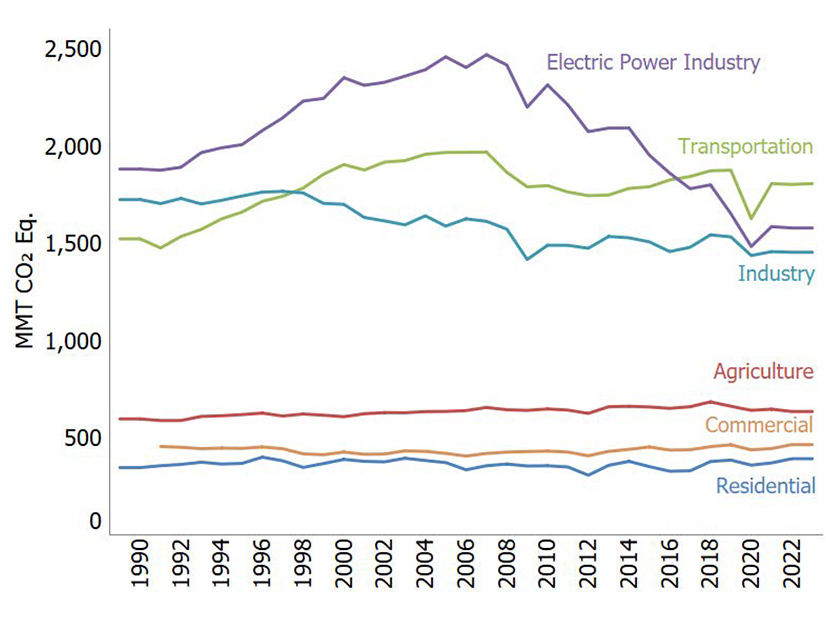
Emissions from the transportation sector, the top source of U.S. GHGs at 28%, fell 0.2% from 2021 to 2022. Light-duty vehicles — passenger cars, SUVs and light pickup trucks — accounted for 37% of transportation emissions, and medium- and heavy-duty vehicles contributed 23%, with the remainder coming from off-road sources, which can include heavy-duty construction vehicles. 

U.S. GHG emissions by economic sector, 1990-2022 | EPA

The electric power sector, now the country’s second-largest source of GHGs at 25%, also saw a small drop, 0.4%, even as electricity generation grew by 3%, as coal-fired plants retired and renewable capacity increased, the report says. 

At the same time, electricity produced from natural gas and petroleum increased by 7% and 19%, respectively. 

The commercial and residential sectors’ emissions increased the most from 2021, at 10.4%. The report notes that building energy use — and GHG emissions — will vary seasonally, but part of the increase in 2022 can be traced to an increase in heating and cooling “degree days,” or days when colder or hotter weather may trigger increased demand for heating or cooling, respectively. 

Heating degree days increased by 7.9% from 2021 to 2022, while cooling degree days rose by 4.3%. According to the Energy Information Administration, the Mountain West states had the most heating degree days in 2022, while the West South Central states — Texas, Oklahoma, Arkansas and Louisiana — had the highest number of cooling degree days. 

Industrial emissions — 23% of total U.S. GHGs — also dropped 0.2%, while electricity use increased 3% over 2021 levels. Accounting for 10% of emissions, the agricultural sector scored a 1.8% drop in GHGs, the report says. 

The inventory’s preliminary figures for 2023 show decreases, with U.S. energy use falling 1% and GHG emissions dropping 3%, a step in the right direction but still not fast or steep enough to reach the nation’s 2030 targets. 

City Council Vote Stalls Planned Wisconsin Gas-fired Plant

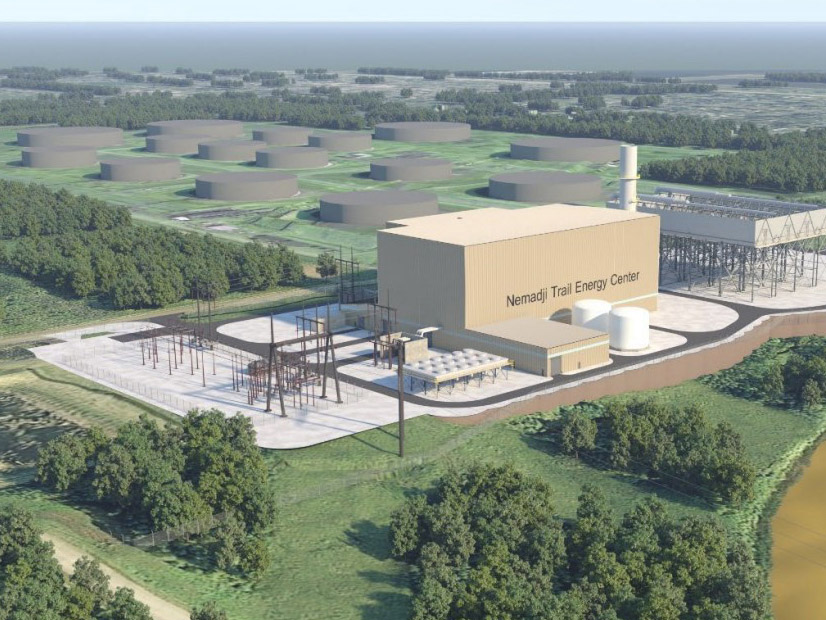
The planned 625-MW gas-fired Nemadji Trail Energy Center in Wisconsin encountered another hitch after the Superior City Council refused to move ahead on zoning changes necessary to break ground on the plant.  

At its April 3 meeting, the council voted 5-4 on a roll-call vote to set public hearings required by state law to make land use changes from suburban to heavy industry and vacate streets to allow for the nearly $1 billion gas plant. But the motion, which required six votes to pass per city code, failed, stalling the plant’s development.  

Plant co-developer Minnesota Power had requested the land use changes, which would have altered the city’s comprehensive plan. 

Construction on the Nemadji Trail plant and associated transmission line has yet to begin, according to a quarterly filing with the Wisconsin Public Service Commission by project partners Minnesota Power, Dairyland Power Cooperative and Basin Electric Power Cooperative.  

The vote against the plant appeared to be motivated by a groundswell of opposition from Superior residents. Several people attending the city council meeting spoke out against the plant before the vote, expressing worries over wetland habitat loss, air quality, greenhouse gases that would worsen climate change and stranded asset costs.  

Multiple residents expressed disbelief at the U.S. Department of Agriculture Rural Utilities Service’s final supplemental environmental assessment, which found the plant “would not cumulatively contribute to significant adverse air quality impacts.” They also contended that the plant fundamentally contradicts the city’s 2040 comprehensive plan, which calls for waterfront cleanup, preservation and tourism opportunities, among other goals.  

Jadine Sonoda, of the Sierra Club’s Wisconsin chapter, said the plant would be “expensive and dangerous decades down the line.” 

“Gas has no place in our transition to clean energy, and I really want to underscore that,” Sonoda said.  

Milo Peterson, a 15-year-old Superior resident, said, “To put it simply, this project goes against my values … and doesn’t seem like a very considerate thing to do for the environment.”  

“I’m asking you to think of my future,” he asked council members. 

Superior Mayor Jim Paine said it’s “extraordinary risky” to develop the plant on undeveloped wetland near the banks of the Nemadji River, as the potential for erosion is high.  

However, Superior Councilor Brent Fennessey said the city council shouldn’t have used residents’ opposition to the plant to deny an opportunity for a public hearing on land use changes. He said he didn’t think Superior was giving Minnesota Power a fair process.  

Paine said allowing hearings would have signaled that Superior was open to rezoning changes to host the plant.  

Councilor Jenny Van Sickle said she took exception to Minnesota Power insinuating the plant could be used for hydrogen when the plant’s partners haven’t made any design changes to accommodate the fuel. She also said the design remains out of step with EPA’s suggestion for a form of carbon capture.   

Artist rendering of the Nemadji Trail Energy Center | Nemadji Trail Energy Center

‘Disappointed’

Last year, Nemadji Trail’s developers said pushback from environmental groups was partly responsible for delaying the plant’s expected commercial operation date from 2027 to 2028. Construction was set to begin this month — but that was before the city council refused to begin zoning procedures. (See Wisconsin Gas Plant Delayed as Enviros Still Try to Block Project.) 

Environmentalists maintain the plant is unnecessary and would increase emissions at a time when utilities need to scale back on polluting resources. They’ve also raised concerns about the plant’s location near wetlands.  

In 2022, Wisconsin’s Dane County Circuit Court rejected arguments from the Sierra Club and Clean Wisconsin that the Wisconsin PSC didn’t sufficiently consider the full environmental impact of the plant when it granted it a certificate of public convenience and necessity. The plant has yet to secure permitting approvals from the U.S. Army Corps of Engineers.  

Minnesota Power, which would build and operate the plant, has pledged to close its two remaining coal-fired power plants by 2035, generate more than 70% of its energy from renewables by 2030, achieve an 80% reduction in carbon emissions by 2035 and produce only carbon-free energy by 2050. (See Minnesota Power IRP Pledges End to Coal by 2035.) 

Minnesota Power has framed Nemadji Trail as a vital supply of backstop power when renewables aren’t available during the clean energy transition.  

The utility did not respond to RTO Insider’s request for comment about its plans following the council’s vote. Spokesperson Amy Rutledge previously told local news outlets in a statement that Minnesota Power is “disappointed by the lack of transparency and communication surrounding the hearing, and with the city’s disregard for conducting a fair process involving all interested parties.”  

Rutledge said Minnesota Power is evaluating next steps with partners Dairyland and Basin Electric “to ensure we meet our commitment to safe, reliable and affordable power in this clean energy transformation.” 

In 2022, MISO wrote a letter to the Rural Utilities Service in support of a loan for Nemadji Trail. The grid operator asked the federal agency to consider its looming generation shortfalls, grid reliability and the plant’s potential role in the RTO’s resource adequacy.