MISO Warming to Patton’s Sloped Demand Curve

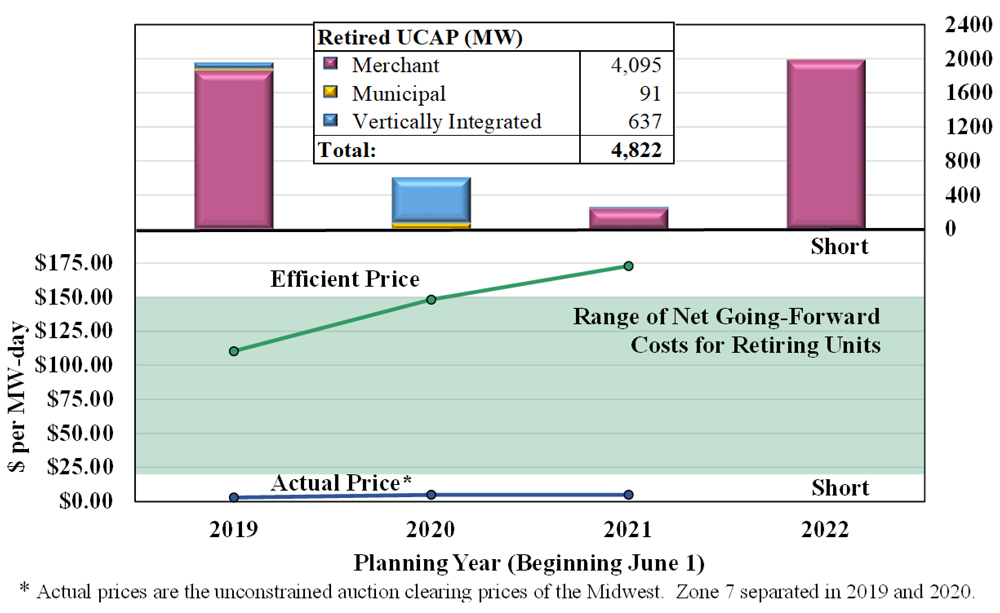
MISO's Independent Market Monitor David Patton presented this graph as an example of how a sloped demand curve would look in the RTO's capacity auctions. The vertical "curve" represents the minimum resource requirement. | Potomac Economics
Jun 24, 2022
|
MISO's board may be coming around to the idea of using a sloped demand curve to price capacity as the RTO confronts the possibility of resource shortages.
